GaAsPBi_band_gap__supplemental
advertisement
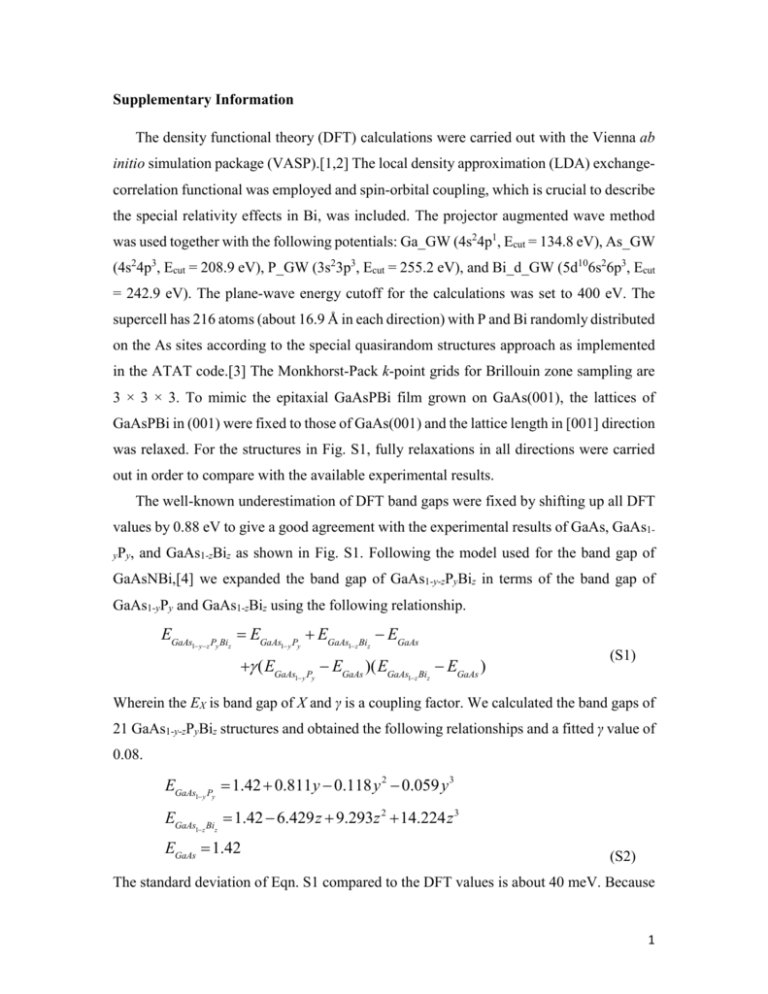
Supplementary Information The density functional theory (DFT) calculations were carried out with the Vienna ab initio simulation package (VASP).[1,2] The local density approximation (LDA) exchangecorrelation functional was employed and spin-orbital coupling, which is crucial to describe the special relativity effects in Bi, was included. The projector augmented wave method was used together with the following potentials: Ga_GW (4s24p1, Ecut = 134.8 eV), As_GW (4s24p3, Ecut = 208.9 eV), P_GW (3s23p3, Ecut = 255.2 eV), and Bi_d_GW (5d106s26p3, Ecut = 242.9 eV). The plane-wave energy cutoff for the calculations was set to 400 eV. The supercell has 216 atoms (about 16.9 Å in each direction) with P and Bi randomly distributed on the As sites according to the special quasirandom structures approach as implemented in the ATAT code.[3] The Monkhorst-Pack k-point grids for Brillouin zone sampling are 3 × 3 × 3. To mimic the epitaxial GaAsPBi film grown on GaAs(001), the lattices of GaAsPBi in (001) were fixed to those of GaAs(001) and the lattice length in [001] direction was relaxed. For the structures in Fig. S1, fully relaxations in all directions were carried out in order to compare with the available experimental results. The well-known underestimation of DFT band gaps were fixed by shifting up all DFT values by 0.88 eV to give a good agreement with the experimental results of GaAs, GaAs1yP y, and GaAs1-zBiz as shown in Fig. S1. Following the model used for the band gap of GaAsNBi,[4] we expanded the band gap of GaAs1-y-zPyBiz in terms of the band gap of GaAs1-yPy and GaAs1-zBiz using the following relationship. EGaAs 1-y-z Py Biz = EGaAs 1- y Py +g (EGaAs + EGaAs 1-y Py 1-z Biz - EGaAs - EGaAs )(EGaAs 1-z Biz - EGaAs ) (S1) Wherein the EX is band gap of X and γ is a coupling factor. We calculated the band gaps of 21 GaAs1-y-zPyBiz structures and obtained the following relationships and a fitted γ value of 0.08. EGaAs = 1.42 + 0.811y - 0.118 y 2 - 0.059 y 3 EGaAs = 1.42 - 6.429z + 9.293z 2 +14.224z 3 1- y Py 1-z Biz EGaAs = 1.42 (S2) The standard deviation of Eqn. S1 compared to the DFT values is about 40 meV. Because 1 the experimental data in Fig. S1 have y in the range 0-0.40 and z in the range 0-0.10, the above equations and fitted value should be considered applicable only for y and z values close to the above-mentioned ranges. Note that GaAs1-yPy has a direct band gap for y < 0.48 and an indirect one for y ≥ 0.48. Therefore, the band gap formula for GaAs1-yPy in Eqn. S2 should only be used for y < 0.48. Experimental band gap (eV) 2.0 1.5 0.88 eV 1.0 GaAsP GaAs 0.5 GaAsBi 0.0 0.0 0.5 1.0 1.5 DFT gap (eV) 2.0 Figure S1. DFT band gaps versus experimental values for fully relaxed GaAs, GaAs1-yPy (y = 0.093, 0.167, 0.250, 0.306, 0.333, and 0.398), and GaAs1-zBiz (z = 0.028, 0.046, 0.074, and 0.102). The original DFT gaps are obviously underestimated, but a good agreement with the experimental data is obtained after a constant upward shift of 0.88 eV. The experimental band gaps of relaxed GaAs1-yPy and GaAs1-zBiz are from Ref. 5 and Ref. 6, respectively. [1] G. Kresse, J. Furthmüller, Phys. Rev. B 54, 11169 (1996). [2] G. Kresse, J. Furthmüller, Comput. Mater. Sci. 6, 15 (1996). [3] A. van de Walle, P. Tiwary, M. M. de Jong, D. L. Olmsted, M. D. Asta, A. Dick, D. Shin, Y. Wang, L.-Q. Chen, and Z.-K. Liu, Calphad, 42:13, 2013. [4] A. Janotti, S.-H. Wei, and S. B. Zhang, Phys. Rev. B 65, 115203 (2002). [5] I. Vurgaftman, J. R. Meyer, and L. R. Ram-Mohan, J. Appl. Phys. 89, 5815 (2001). 2 [6] M. Usman, C. A. Broderick, A. Lindsay, and E. P. O’Reilly, Phys. Rev. B 84, 245202 (2011). 3


