Chapter 10 Notes
advertisement
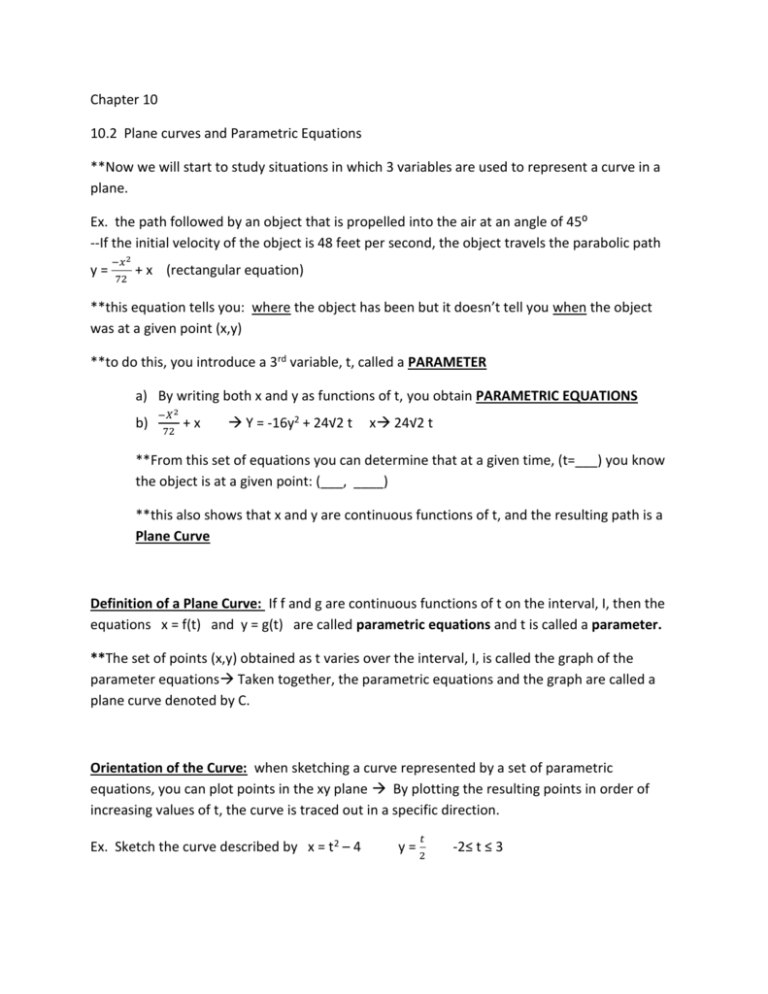
Chapter 10 10.2 Plane curves and Parametric Equations **Now we will start to study situations in which 3 variables are used to represent a curve in a plane. Ex. the path followed by an object that is propelled into the air at an angle of 45⁰ --If the initial velocity of the object is 48 feet per second, the object travels the parabolic path y= −𝑥 2 72 + x (rectangular equation) **this equation tells you: where the object has been but it doesn’t tell you when the object was at a given point (x,y) **to do this, you introduce a 3rd variable, t, called a PARAMETER a) By writing both x and y as functions of t, you obtain PARAMETRIC EQUATIONS b) −𝑋 2 72 +x Y = -16y2 + 24√2 t x 24√2 t **From this set of equations you can determine that at a given time, (t=___) you know the object is at a given point: (___, ____) **this also shows that x and y are continuous functions of t, and the resulting path is a Plane Curve Definition of a Plane Curve: If f and g are continuous functions of t on the interval, I, then the equations x = f(t) and y = g(t) are called parametric equations and t is called a parameter. **The set of points (x,y) obtained as t varies over the interval, I, is called the graph of the parameter equations Taken together, the parametric equations and the graph are called a plane curve denoted by C. Orientation of the Curve: when sketching a curve represented by a set of parametric equations, you can plot points in the xy plane By plotting the resulting points in order of increasing values of t, the curve is traced out in a specific direction. Ex. Sketch the curve described by x = t2 – 4 𝑡 y=2 -2≤ t ≤ 3 **Because graphs would not pass vertical line test it does not define y as a function of x #1. BENEFIT OF PARAMETRIC EQUATION = can be used to represent graphs that are more general than graphs of functions #2. Different parametric representations can be used to represent various speeds at which objects travel along a given path. ELIMINATING THE PARAMETER – when you find a rectangular equation that represents the graph of a set of parametric equations. Ex. Parametric Equation Solve for t in 1 eq.--> Substitute into the 2nd eq. Rect. Eq. X = t2 – 4 𝑡 Y=2 x = (2y)2 – 4 x = 4y2 - 4 t = 2y **The range of x and y implied by the parametric equations may be altered by the change to rectangular form if so the DOMAIN of rectangular equations must be adjusted so that its graph matches the graph of the parametric equations. Ex. Sketch the curve represented by the equations: X= 1 and y = √𝑡+1 𝑡 𝑡+1 t > -1 by eliminating the parameter and adjusting the domain. Step 1: Solve 1 of the parametric equations for t: 1 (x)2 = (√𝑡+1)2 x2 = 1 𝑡+1 1 1 flip so end up with t + 1 = 𝑥 2 t = 𝑥 2 - 1 t = 1−𝑥 2 𝑥2 Step 2: Now Substitute into parametric equation for y Y= 1−𝑥2 𝑥2 1− 𝑥2 +1 𝑥2 = y = 1-x2 - which is defined for all values of x , but from the parametric equation for x you can see the curve is defined only when t > -1 **So you restrict the domain of x to positive values ** The parameter – doesn’t have to represent time – next example if represents an angle Ex. Sketch the curve represented by x = 3 cosθ y = 4sinθ 0≤ θ≤ 2π by eliminating the parameter and finding rectangular equation #1. Solve for sin and cos. In both: 𝑥 Cosθ = 3 𝑦 sinθ = 4 major =8 𝑥 𝑦 Use the identity: (3)2 + ( 4)2 = 1 𝑥2 9 𝑦2 + 16 = 1 (ellipse centered at (0,0) (0,4)(0,-4) minor 6 Graph in Form of 1) x = h+ acosθ counterclockwise y= k + bsin θ Graphs in form: 1) x = h+ asinθ y = k + bcosθ 0≤ θ≤ 2π 0≤ θ≤ 2π is an ellipse traced is an ellipse traced clockwise **PURPOSE IN ELIMINATING PARAMETER: aid to curve sketching ** Need parametric equations to: 1) tell you position 2) direction 3) speed at a given time Finding Parametric Equations: Ex. find a set of parametric equations to represent the graph of y = 1- x2, using each of the parameters a. t = x 𝑑𝑦 b. the slope m= 𝑑𝑥 at the point (x,y) a) Letting x = t produces: y = 1 – t2 and x = t 𝑑𝑦 𝑚 b) To write x and y in terms of m: m = 𝑑𝑥 = −2𝑥 x = −2 is parametric eq. for x 𝑚 c) For y y = 1 – (−2)2 y = 1 - 𝑚2 4 Parametric equations for a cycloid: Ex. Determine the curve traced by a point P, on the circumference of a circle of radius a, rolling along a straight line in a plane (cycloid) #1. Let the parameter θ = the measure of the circle’s rotation. Let point P = (x,y) begin at origin When θ = 0 P = (0,0) When θ = π P is at a maximum point (πa, 2a) angle APC = 180 – θ When θ = 2π P is back on x-axis at (2πa, 0) so sinθ = sin(180-θ) = sin APC = 𝐴𝐶 𝑎 = 𝐵𝐷 𝑎 𝐴𝐷 Cosθ = -cos(180 – θ) = -cos angle APC = −𝑎 Implies: AP = -acosθ and BD = asinθ Parametric equations are: x = a(θ – sinθ) y = a(1-cosθ) X’(θ) = a – acosθ y’(θ) = asinθ x’(2π) = 0 y’(2π) = 0 Between these points the cycloid is called smooth. DEFINITION OF A SMOOTH CURVE: a curve c represented by x = f(t) and y = G(t) on an interval, I, is called smooth if f’ and g’ are continuous on I and not simultaneously 0, except possibly at the endpoints of I Curve C is piecewise sm0oth = if it is smooth on each subinterval of some partition of I 10.3 Parametric Equations and Calculus Theorem 10.7 Parametric Form of the Derivative: If a smooth curve C is given by the equations x= f(t) and y = g(t). Then the slope of C at (x,y) is 𝒅𝒚 𝒅𝒙 = 𝒅𝒚/𝒅𝒕 𝒅𝒚 𝒅𝒙/𝒅𝒕 𝒅𝒙 ≠ 𝟎 Ex. Find dy/dx for the curve given by: x = sint and y=cost 𝑑𝑦 𝑑𝑥 = 𝑑𝑦/𝑑𝑡 𝑑𝑥/𝑑𝑡 = − sin 𝑡 cos 𝑡 = - tant For Higher Derivatives: 𝒅𝟐 𝒚 𝒅𝒙𝟐 = 𝒅 𝒅𝒚 [ ]= 𝒅𝒙 𝒅𝒙 𝒅 𝒅𝒚 [ ] 𝒅𝒕 𝒅𝒙 𝒅𝒙 𝒅𝒕 Ex. Finding Slope and Concavity For the curve given by: x = √t and y = ¼(t2 – 4) t ≥ 0 find the slope and concavity at (2,3) Step #1 𝑑𝑦 𝑑𝑥 = 𝑑𝑦/𝑑𝑡 𝑑𝑥/𝑑𝑡 You could find the = −1 1 2 𝑡 2 1 𝑡 2 2nd = t3/2 derivative to be 𝑑2 𝑦 𝑑𝑥 2 = 𝑑 𝑑𝑦 [ ] 𝑑𝑡 𝑑𝑥 𝑑𝑥 𝑑𝑡 = 3 𝑑 2] [𝑡 𝑑𝑡 1 −1/2 𝑡 2 = 3 1/2 𝑡 2 1 −1/2 𝑡 2 = 3t At (x,y) = (2,3) it follows that: 3 = ¼(t2-4) 12 = t2 – 4 16 = t2 t = 4 and slope is 𝑑𝑦 𝑑𝑥 = 43/2 =8 2nd Derivative: 3(4) = 12 12>0 so concave up at (2,3) Ex. A Prolate Cycloid given by x = 2t- πsin t and y = 2 –π cost t crosses itself a the point (0,2). Find the equation of both tangent lines at this point. Solution: Because x = 0 and y = 2 when t = ± π/2 and 𝑑𝑦 𝑑𝑥 = 𝑑𝑦/𝑑𝑡 𝑑𝑥/𝑑𝑡 = 𝜋𝑠𝑖𝑛𝑡 2− 𝜋𝑐𝑜𝑠𝑡 ( 2 = 2-πcost 0 = -πcost 0 When x =0 and y=2 when t = ±π/2 = cos t ±𝜋/2 You have 𝑑𝑦 𝑑𝑥 = −𝜋 2 when t = −𝜋 2 and 𝑑𝑦 𝑑𝑥 = 𝜋 2 when t = 𝜋 2 𝜋 𝜋 2 2 ** So the 2 tangent lines at (0,2) are y – 2 = - - (x) and y -2 = (x) --**If dy/dt = 0 and dx/dt ≠ 0 when t = to the curve represented by x = f(t) and y = g(t) has a horizontal tangent at (f(to), g(to)) ---- in above example there is a horizontal tan. At (0,2-π) when t = 0 --** If dx/dt = 0 and dy/dt≠ 0 when t = to, the curve represented by x = f(t) and y = g(t) has a vertical tangent at (f(to), g(to)) ARC LENGTH - parametric equations can be used to describe the path of a particle moving in the plane. is also used to determine THE DISTANCE traveled by the particle along its path Theorem 10.8 Arc Length in Parametric Form: If a smooth curve C is given by x = f(t) and y = g(t) such that C does not intersect itself on the interval a≤ t ≤ b (except possibly at endpoints) then the arc length of C over the interval is given by: 𝒃 𝒅𝒙 𝒅𝒚 𝒃 S = ∫𝒂 √( )𝟐 + ( )𝟐 dt = ∫𝒂 √[𝒇′ (𝒕)]𝟐 + [𝒈′ (𝒕)]𝟐 𝒅𝒕 𝒅𝒕 𝒅𝒕 (When applying formula make sure that the curve is traced out only once on the interval of integration) EPICYCLOID = if a circles’ path rolls around the circumference of another circle Ex. Finding Arc Length A circle of radius 1 rolls around the circumference of a larger circle or radius 4 as shown below. The epicycloid traced by a point on the circumference of the smaller circle is given by: X = 5cost – cos5t and y = 5sint – sin5t Find the distance traveled by the point in 1 complete trip about the larger circle Notice: curve has sharp points when t – 0 and t = Between these 2 points 𝑑𝑥 𝑑𝑡 and 𝑑𝑥 𝑑𝑡 𝜋 2 are not simultaneously 0 𝜋 So the position of the curve generated from t = 0 to t = is 2 smooth Now to find total distance traveled by the point you find the arc length of that position in the 1st Quadrant and multiply by 4 𝜋/2 S = 4 ∫0 𝜋/2 4∫0 𝑑𝑥 𝑑𝑦 𝑑𝑡 𝑑𝑡 √( )2 + ( )2 dt = √(−5𝑠𝑖𝑛𝑡 + 5𝑠𝑖𝑛5𝑡)2 + (5𝑐𝑜𝑠𝑡 − 5 cos 5𝑡)2 𝑑𝑡 𝜋/2 = 20 ∫0 √2 − 2𝑠𝑖𝑛𝑡𝑠𝑖𝑛5𝑡 − 2𝑐𝑜𝑠𝑡𝑐𝑜𝑠5𝑡 𝑑𝑡 𝜋/2 = 20 ∫0 𝜋/2 = 20 ∫0 𝜋/2 = 40 ∫0 √2 − 2𝑐𝑜𝑠4𝑡 𝑑𝑡 √4𝑠𝑖𝑛3 2𝑡 𝑑𝑡 𝑠𝑖𝑛2𝑡 𝑑𝑡 = -20[cos 2t] evaluated at 𝜋 2 𝑎𝑛𝑑 0 = 40 Do Length of Recording Tape Ex. Area of a Surface of Revolution - If a smooth curve C given by x = f(t) and y = g(t) does not cross itself on an interval a≤ t ≤ b, then the area S of the surface of revolution formed by revolving C about the coordinate axes is given by the following: 𝒃 𝒅𝒙 𝒅𝒚 𝒅𝒕 𝒅𝒕 1. S = 2π∫𝒂 𝒈(𝒕)√( )𝟐 + ( )𝟐 dt REVOLUTION ABOUT THE X-AXIS g(t) ≥ 0 𝒃 𝒅𝒙 𝒅𝒚 𝒅𝒕 𝒅𝒕 2. S= 2π∫𝒂 𝒇(𝒕)√( )𝟐 + ( )𝟐 dt REVOLUTION ABOUT THE Y-AXIS f(t) ≥ 0 3 3√3 Ex. Let C be the arc of the circle x2 + y2 = 9 from (3,0) to ( , 2 2 ). Find the are of the surface formed by revolving C about the x-axis. You can represent C parametrically by the equations x = 3cost y = 3sint 0 ≤ t ≤ π/3 𝜋/3 S = 2π∫0 3𝑠𝑖𝑛𝑡√(−3𝑠𝑖𝑛𝑡)2 + (3𝑐𝑜𝑠𝑡)2 𝑑𝑡 𝜋/3 = 6𝜋 ∫0 𝜋/3 = 6𝜋 ∫0 𝑠𝑖𝑛𝑡√9(𝑠𝑖𝑛2 𝑡 + 𝑐𝑜𝑠 2 𝑡)𝑑𝑡 3𝑠𝑖𝑛𝑡 𝑑𝑡 = -18π[cost] evaluated at π/3 to 0 = -18π(1/2 – 1) = 9𝜋 10.4 Polar Coordinates and Polar Graphs To form polar coordinate system: 1. Fix a point O called POLE (or origin) 2. Construct from O an initial ray called POLAR AXIS 3. Each point P, in plane can be assigned polar coordinates (r,θ) r = directed distance from 0 to P θ = directed angle, counterclockwise from polar axis to OP *with polar (r,θ) and (r, 2π+θ) represent the same point * since r is directed distance, then (r,θ) and (-r,θ+π) represent same point ***So (r,θ) can be written as: = (r, θ + 2nπ) or (-r, θ + (2n+1)π) Coordinate Conversion: Theorem 10.10 The polar coordinates (r, θ) of a point are related to the rectangular coordinates (x,y) of the point as follows: X = rcosθ y = rsinθ tanθ = 𝒙 𝒚 r2 = x2 + y2 r = √𝒙𝟐 + 𝒚𝟐 Ex. From Polar to Rectangular (2,π) X = 2cosπ y = 2sinπ 2(0) = 0 (-2,0) 2(-1) = -2 Ex. Rectangular to Polar (-1,1) R = √(−1)2 + (1)2 = √2 So (√2 , 3𝜋 4 tan = 1 −1 = -1 tan-1(-1) = 3𝜋 4 ) Polar Graphs Ex. Describe the graph of each polar equation. Confirm each description by converting to a rectangular equation a. r = 2 b. θ= 𝜋 3 c. r= secθ a) R = 2 consists of all points that are 2 units from the pole (rect. Equation = 22 = x2 + y2 b) θ= 𝜋 3 consists of all the points on the line that makes an angle of 𝜋 3 with a positive x – axis c) r = secθ must be converted to rectangular form: rcosθ = 1 x = 1 Ex. Sketch the graph of r=2cos3θ **write polar equation in parameter mode: X = 2cos3θcosθ y = 2cos3θsinθ or make a table of values: Θ r 0 2 π/6 0 π/3 -2 π/2 0 3π/2 2 Letting θ vary from 0 to π gives you a rose curve ROSE CURVE – of form r = acosnθ and r = asinnθ Slope and Tangent Lines find by using parametric equations X = rcosθ = f(θ)cosθ section Theorem 10.11 and y = rsinθ = f(θ)sinθ then use dy/dx from last 𝒅𝒚 𝒅𝒙 = 𝒅𝒚/𝒅𝜽 𝒅𝒙/𝒅𝜽 = 𝒇(𝜽)𝒄𝒐𝒔𝜽 +𝒇′ (𝜽)𝒔𝒊𝒏𝜽 ** if f is −𝒇(𝜽)𝒔𝒊𝒏𝜽+𝒇′ (𝜽)𝒄𝒐𝒔𝜽 differentiable function of θ then the slope of the tangent line to the graph of r=f(θ) at point (r,θ) is given by above formula ** 1. Solutions to ** 2. Solutions to ** If 𝑑𝑦 𝑑𝜃 and 𝑑𝑥 𝑑𝜃 𝒅𝒚 𝒅𝜽 𝒅𝒙 𝒅𝜽 = 0 yield Horizontal tangents provided that = 0 yields Vertical tangents provided that 𝑑𝑦 𝑑𝜃 𝑑𝑥 𝑑𝜃 ≠0 ≠0 are simultaneously 0, no conclusion can be drawn about tangent lines. Ex. Find the Horizontal and Vertical tangent lines of r=sinθ 0≤θ≤π Step 1: write in parametric form x = rcosθ = sinθcosθ And y = rsinθ = sinθsinθ = sin²θ Step 2: differentiate x and y with respect to θ and set each derivative=0 𝑑𝑥 𝑑𝜃 𝑑𝑦 𝑑𝜃 𝜋 3𝜋 = cos2θ – sin2θ = cos2θ (double ange identity) = 0 θ = , 4 = 2sinθcosθ = sin2θ (double angle identity) = 0 √2 𝜋 2 4 θ = 0, 4 𝜋 2 √2 3𝜋 ) 2 4 So graph has vertical tangents at ( , ) and ( , 𝜋 And horizontal tangents at (0,0) and (1, ) 2 Ex. find the horizontal and vertical tangents to the graph of r=2(1-cosθ) y = rsinθ = 2(1-cosθ)sinθ = 2[(1-cosθ)(cosθ+sinθ(sinθ))] = -2(2cosθ+1)(cosθ -1) = 0 Cosθ = ½ cosθ = 1 So 𝑑𝑦 𝑑𝜃 = 0 when θ = 2𝜋 4𝜋 3 3 and 0 X = rcosθ = 2cosθ – 2cos²θ 𝑑𝑥 𝑑𝜃 = -2sinθ + 4cosθsinθ = 2sinθ(2cosθ – 1) = 0 Sinθ = 0 or cos θ = ½ So 𝑑𝑥 𝑑𝜃 = 0 when θ = 𝜋 5𝜋 3 3 and 0, π Symmetry Test for Polar Graphs: 1. Symmetry about x-axis: if point (r,θ) lies on the graph, the point (r,-θ) or (-r,π-θ) lies on the graph 2. Symmetry about y-axis: if point (r,θ) lies on the graph, the point (r,π-θ) or (-r,-θ) lies on the graph 3. Symmetry about the origin: If point (r,θ) lies on the graph, the point (-r,θ) or (r, θ+π) lies on the graph. Ex. identify the symmetries of the curves: a) R = 1+cosθ b) R = 2 + sinθ Slopes of Polar Curves #17 ex. cardiod r = -1 + cosθ θ=± 𝜋 2 𝜋 𝜋 2 2 so (-1, ) or (-1, - ) 10.5 Area and Arc Length in Polar Coordinates: **using sectors of a circle instead of rectangles Area of a Sector: = ½θr2 **graph is bound by radial lines θ=α and θ=β 1) To find area of the region, partition the interval [α,β] into n equal subintervals 2) Then approximate the area of the region by the sum of the areas of the n sectors **all of this leads to the proof of the following theorem: Theorem 10.13 Area in Polar Coordinates: If f is continuous and nonnegative on the interval [α,β] and 0< β-α≤2π then the area of the region bounded by the graph of R=f(θ) between the radial lines θ=α and θ=β is given by: 𝛽 𝛽 A = ½∫𝛼 [𝑓(𝜃0]2 𝑑𝜃 ½ ∫𝛼 𝑟 2 𝑑𝜃 Ex. Find the area of 1 petal of the rose curve given by r = 3cos3θ Notice right petal is traced as θ increases from –π/6 to π/6 so area is: 𝜋/6 =½∫−𝜋/6(3𝑐𝑜𝑠3𝜃)2 𝑑𝜃 Ex. Find the area of the region lying between the inner and outer loops of the limoncon r = 1- 2sinθ 5𝜋/6 =½∫𝜋/6 (1 − 2𝑠𝑖𝑛𝜃)2 dθ Points of Intersection of Polar Graphs – sketch the graphs b/c may miss a point. To find, just set equations equal to each other or substitute one equation in for another. Ex. Find the area of the region common to the 2 regions bounded by the following: r=6cosθ r=2-2cosθ Arc Length in Polar Form: Theorem 10.14 Arc Length of Polar Curve Let f be a function whose derivative is continuous on an interval α≤θ≤β. The length of the graph of r = f(θ) from θ=α to θ=β is 𝜷 S = ∫∝ √[𝒇(𝜽)]𝟐 + [𝒇′ (𝜽)]𝟐 𝜷 𝒅𝒓 S = ∫∝ √𝒓𝟐 + [ ]𝟐 𝒅𝜽 𝒅𝜽 Ex. Find the length of the arc from θ = 0 to θ = 2π for the cardiod r=f(θ) = 2-2cosθ f’(θ) = 2sinθ Area of a Surface of Revolution – use parametric equation x=rcosθ y = rsinθ Theorem 10.15 Area of a Surface of Revolution: Let f be a function whose derivative is continuous on an interval α≤θ≤β. The area of the surface formed by revolving the graph of r=f(θ) from θ=α to θ=β is 1. 𝜷 S = 𝟐𝝅 ∫∝ 𝒇(𝜽)𝒔𝒊𝒏𝜽√[𝒇(𝜽)]𝟐 + [𝒇′ (𝜽)]𝟐 dθ about the polar axis 𝜷 2. S = 𝟐𝝅 ∫∝ 𝒇(𝜽)𝒄𝒐𝒔𝜽√[𝒇(𝜽)]𝟐 + [𝒇′ (𝜽)]𝟐 dθ about the line θ= Ex. Find the area of the surface formed by revolving the circle r=f(θ)=cosθ about the line 𝜋 2 𝝅 𝟐
