Chapter-7-worksheet-packet
advertisement
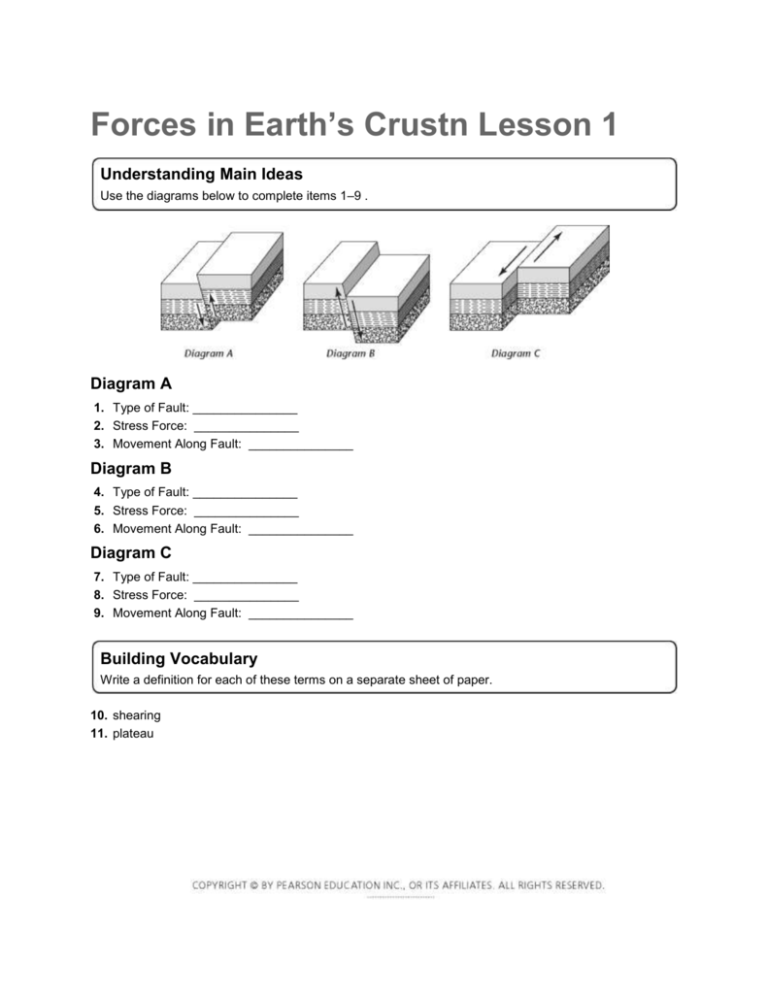
Forces in Earth’s Crustn Lesson 1 Understanding Main Ideas Use the diagrams below to complete items 1–9 . Diagram A 1. Type of Fault: _______________ 2. Stress Force: _______________ 3. Movement Along Fault: _______________ Diagram B 4. Type of Fault: _______________ 5. Stress Force: _______________ 6. Movement Along Fault: _______________ Diagram C 7. Type of Fault: _______________ 8. Stress Force: _______________ 9. Movement Along Fault: _______________ Building Vocabulary Write a definition for each of these terms on a separate sheet of paper. 10. shearing 11. plateau Forces in Earth’s Crust Lesson 1 Each picture below shows how an earthquake changed the land surface at a fault. Examine the pictures carefully. Decide what kind of fault is shown in each. Then explain how movement along the fault caused the changes you see. Write your answers in the spaces provided. 1. Fault 1 __________________________________________________________________________ 2. Fault 2 __________________________________________________________________________ 3. Fault 3 Earthquakes and Seismic Waves Lesson 2 If the statement is true, write true. If the statement is false, change the underlined word or words to make the statement true. 1. _____________ The shaking and trembling that results from movement of rock beneath Earth’s surface is called an earthquake. 2. _____________ Earthquakes are caused by the forces of mountain movement. 3. _____________ The epicenter of an earthquake is below the focus. 4. _____________ P waves can become surface waves when they reach Earth’s surface. 5. _____________ The Modified Mercalli scale rates the amount of damage from an earthquake. 6. _____________ To locate the epicenter of an earthquake, geologists need data from two or more seismographs. Fill in the blank to complete each statement. 7. Seismic waves are _____________ that are similar to sound waves. 8. The _____________ of an earthquake is the point where rock under stress begins to break or move. 9. The seismic waves that move fastest are _____________. 10. Geologists use the moment magnitude scale to rate the total _____________ released by an earthquake. Monitoring Earthquakes Lesson 3 Read the passage and look at the diagram. Then use a separate sheet of paper to answer the questions that follow the diagram. Earthquake Probability This combined map and bar graph shows the probability of earthquakes in different areas along the san Andreas fault. Probability is a measure of how likely it is that some event will happen in a given time. A probability near 100 percent means that an event in very likely to happen. A probability near zero percent means that an event is very unlikely to happen. 1. Which area has the highest probability of an earthquake? 2. What is the probability of an earthquake in the North Coast area? 3. The fault section between the Santa Cruz Mountains and Parkfield has a very low probability. Geologists know that this area has experienced very little damaging seismic activity in the past. They also found that the blocks of rock in this section move slowly and continually. Why would slow, continual movement lead geologists to give the section a low probability? 4. What can you infer about why the probability of an earthquake is so high in the Parkfield area?


