Comparison of Micropterus salmoides population characteristics
advertisement
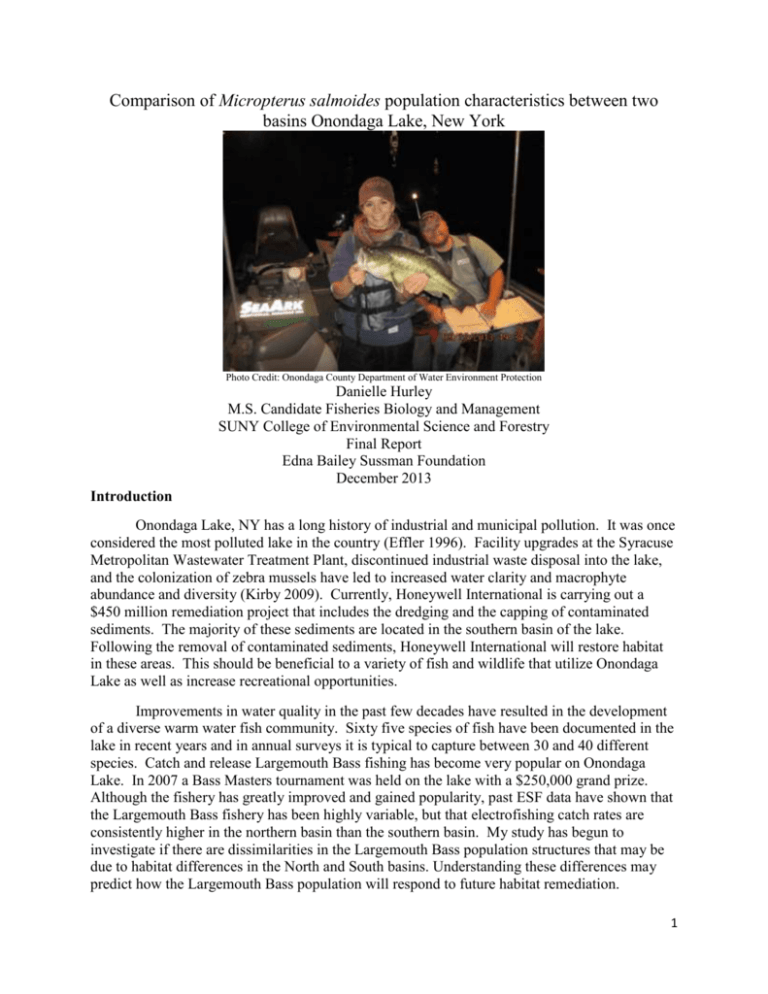
Comparison of Micropterus salmoides population characteristics between two basins Onondaga Lake, New York Photo Credit: Onondaga County Department of Water Environment Protection Danielle Hurley M.S. Candidate Fisheries Biology and Management SUNY College of Environmental Science and Forestry Final Report Edna Bailey Sussman Foundation December 2013 Introduction Onondaga Lake, NY has a long history of industrial and municipal pollution. It was once considered the most polluted lake in the country (Effler 1996). Facility upgrades at the Syracuse Metropolitan Wastewater Treatment Plant, discontinued industrial waste disposal into the lake, and the colonization of zebra mussels have led to increased water clarity and macrophyte abundance and diversity (Kirby 2009). Currently, Honeywell International is carrying out a $450 million remediation project that includes the dredging and the capping of contaminated sediments. The majority of these sediments are located in the southern basin of the lake. Following the removal of contaminated sediments, Honeywell International will restore habitat in these areas. This should be beneficial to a variety of fish and wildlife that utilize Onondaga Lake as well as increase recreational opportunities. Improvements in water quality in the past few decades have resulted in the development of a diverse warm water fish community. Sixty five species of fish have been documented in the lake in recent years and in annual surveys it is typical to capture between 30 and 40 different species. Catch and release Largemouth Bass fishing has become very popular on Onondaga Lake. In 2007 a Bass Masters tournament was held on the lake with a $250,000 grand prize. Although the fishery has greatly improved and gained popularity, past ESF data have shown that the Largemouth Bass fishery has been highly variable, but that electrofishing catch rates are consistently higher in the northern basin than the southern basin. My study has begun to investigate if there are dissimilarities in the Largemouth Bass population structures that may be due to habitat differences in the North and South basins. Understanding these differences may predict how the Largemouth Bass population will respond to future habitat remediation. 1 Methods Population Estimate Between May and July 2013 Largemouth Bass were sampled throughout Onondaga Lake during mark recapture events. The shoreline was sampled four times at 1-meter depth using a 5.49 m Smith Root electrofishing boat. I used 170 V pulsed DC at 120 Hz and generated 2025A. During the first three sampling events all Largemouth Bass larger than 200 mm received a fin clip and all Largemouth Bass 300 mm or larger had a numbered tag implanted. During events 2 through 4 all Largemouth Bass were inspected for fin clips and tags. I was unable to sample a portion of the southern basin due to dredging activities. Electrofishing was performed between sunset and sunrise. Population estimates were made for the entire lake, as well has for each basin individually, using the Schnabel estimator (Hayes et al. 2007): ̂= 𝑁 ∑𝑡𝑖=2 𝑛𝑖 𝑀𝑖 ∑𝑡𝑖=2 𝑚𝑖 + 1 where t is the number of sampling events, ni is the number of fish captured during the ith event, mi is the number of fish recaptured in the ith event and Mi is the number of already marked fish in the population during the ith event. Age and Growth Scales were collected during the mark recapture sampling to estimate Largemouth Bass ages. An attempt was made to collect 10 scale samples per 25 mm size class (0 mm-550 mm) per basin. This was achievable for most size classes. Fewer scales samples were collected from the very small and very large bass. Scales were pressed onto cellulose acetate slides and aged by projecting the slide on a microfiche projector and counting the apparent annuli. Measurements were made between each annulus to back calculate length at age using the Fraser-Lee Equation (Isely and Grabowski 2007): 𝐿𝑖 = 𝐿𝑐 − 𝑎 𝑆𝑖 + 𝑎 𝑆𝑐 where Si is the radius at annulus formation, Sc is the overall radius of the scale, Li is the length at annulus formation, Lc is the fish length at time of capture, and a is the length at time of scale formation. Diet Stomach flushing using a syringe was used to collect stomach contents from Largemouth Bass in late July and early August. Contents were fixed in 10% buffered formalin and then identified at a later date. An attempt was made to sample 30 fish per basin that contained stomach contents. The Frequency of Occurrence Index (Chipps and Garvey 2007) was used to determine if Largemouth Bass in each basin utilize similar or different prey resources. Frequency of occurrence is calculated using the following equation (Chipps and Garvey 2007): 𝑂𝑖 = 𝐽𝑖 𝑃 2 where Oi is the frequency of occurrence value, Ji is the number of fish containing prey item i, and P is the number of fish that contained stomach contents. Eleven Largemouth Bass were sacrificed to validate that the stomach flushing technique was successful. These fish first had their stomachs flushed. They were then killed and their digestive tracts were dissected to uncover any remaining content. Preliminary Results Population estimate A total 1977 Largemouth Bass were sampled throughout Onondaga Lake during the mark recapture events. In the north basin 1140 Largemouth Bass were sampled and in the south basin 837 were sampled. Of the total captured bass, 1733 were above 200 mm and included in the population estimate. The whole lake was estimated to have a population of 13078 Largemouth Bass 200 mm or larger with a confidence interval of 10739-16718. The north basin was estimated to have 8206 (6301-11763) Largemouth Bass 200 mm or larger and the south basin was estimated to have 5544 (4220-8081) Largemouth Bass 200 mm or larger, where the values in parentheses represent confidence intervals. Table 1. Population estimates for Largemouth Bass for the whole lake and each basin individually using the Schnabel estimator Onondaga Lake, New York 2013. Separate estimates were made for bass over 200 mm and bass over 300 mm. Largemouth bass are legal catch size at 305 mm. Confidence intervals appear in parentheses. Largemouth Bass Population Estimates (Confidence Intervals) Size Range Whole lake North South ≥200 mm 13078 (10739-16718) 8206 (6301-11763) 5545 (4220-8081) ≥300 mm 3819 (2858-5751) 3132 (2057-6557) 1171 (814-2084) Age and Growth I have been able to age 143 scale samples from the north basin and 65 scale samples from the south basin. Back calculation of growth has shown that most Largemouth Bass in Onondaga Lake enter the legal fishery (305 mm) in either their fourth or fifth growing seasons. Comparisons in growth will be made between basins when aging of scale samples from the south basin has been completed. Scales taken from recaptured Largemouth Bass that were captured in previous years will be used to validate age estimates. Diet Stomach flushing (modified from Meehan and Miller 1778) was performed on 137 Largemouth Bass throughout the whole lake. A total of 58 Largemouth Bass had contents in their stomachs. In the north basin 30 Largemouth Bass were sampled with contents in their stomachs and 23 were sampled with empty stomachs. Twenty eight Largemouth Bass contained stomach contents in the south basin, while 44 had empty stomachs. To date 19 stomach samples have been processed from each basin. The frequency of occurrence index suggests that Round Gobies are the most common food resource for Largemouth Bass in Onondaga Lake, followed by Banded Killifish. Although Round Gobies were the most frequently found prey item in both the north and south basins the frequency of occurrence values were very different. Round gobies 3 were found more frequently in Largemouth Bass stomachs in the north (0.79) than in the south (0.37). Table 2. Frequency of Occurrence values for prey items found in Largemouth Bass stomachs in the north and south basins of Onondaga Lake 2013. Frequency of Occurrence Values for Each Prey Item Species North South Round Goby 0.789 0.38 Banded Killifish 0.105 0.158 Alewife 0.051 0 Lepomis 0 0.053 Largemouth Bass 0 0.053 Unidentified Fish Matter 0.632 0.684 Zebra Mussels 0.053 0.211 Tadpole Madtom 0.053 0.053 0 0.053 White Perch Discussion Based on Schnabel estimates, Largemouth Bass are more abundant in the north basin than in the south basin. Largemouth Bass are known to be generalist predators. Bass in both basins showed a fairly diverse diet. Round Gobies appear to be a more common food resource in the north basin than in the south basin. This may be due to the distribution of Round Gobies throughout the lake. Through personal observation there seems to be a higher density of Round Gobies in the north basin. My preliminary evaluation of the Largemouth Bass populations suggested that there is little difference in population characteristics between basins, but there is a larger population of bass in the northern basin. This may be due to more favorable habitat and greater numbers of prey items. Largemouth Bass from the south basin may also have moved into the north basin to avoid large dredging areas currently present in the southern basin. Future Research I will continue to age Largemouth Bass scales samples and compare growth rates between the two basins. The remaining diet samples will be processed and the frequency of occurrence index will be updated to include the remaining data. I also plan to utilize fin rays, otoliths, and cleithrum from Largemouth Bass to estimate ages. This will be used to determine the most accurate and appropriate method for estimating age of Largemouth Bass in Onondaga Lake for the future. Length and weight data will be further analyzed to enhance the comparisons of the north and south basin Largemouth Bass populations. 4 Acknowledgements I would like to thank the Edna Bailey Sussman Foundation for their financial support and the guidance of Emily Zollweg-Horan from the NYSDEC, which made this work possible. I am extremely appreciative of the guidance and support of my major professor Dr. Neil Ringler. Also, I am very grateful to all of those who helped me in my data collection including Zachary Smith, Anne Burnham, Kyle Hodgson, Dan Anderson, Harold Nugent, Rachael DeWitt, and Stephanie Johnson. Thank you also to Lucus Kirby, Stephanie Johnson, Matthew Gunderson, Curtis Karboski, and Stephan Tyszko who provided much guidance in the planning of this project. References Chipps, S.R. and J.E. Garvey. 2007. Assessment of Diets and Feeding Patterns. Pages 473-514 in C.S. Guy and M.L. Brown, editors. Analysis and Interpretation of Freshwater Fisheries Data. American Fisheries Society. Bathesda, Maryland. Effler, S.W. and G. Harnett. 1996. Background. Pages 1-29 in S.W. Effler, editor. Limnological and Engineering Analysis of a Polluted Urban Lake: Prelude to environmental management of Onondaga Lake, New York. Springer-Verlag New York, Inc. Isely, J.J. and T.B. Grabowski. 2007. Age and Growth. Pages 187-228 in C.S. Guy and M.L. Brown, editors. Analysis and Interpretation of Freshwater Fisheries Data. American Fisheries Society. Bathesda, Maryland. Hayes, D.B., J.R. Bence, T.J. Kwak, and B.E. Thompson. 2007. Abundance, Biomass, and Production. Pages 327-374 in C.S. Guy and M.L. Brown, editors. Analysis and Interpretation of Freshwater Fisheries Data. American Fisheries Society. Bathesda, Maryland. Kirby, L. J. 2009. Nesting and recruitment of centrarchids and the oligotrophication of Onondaga Lake, New York. MS thesis. State University of New York, College of Environmental Science and Forestry. 78 pp. Meehan, W. R., and R. A. Miller. Stomach flushing: effectiveness and influence on survival and condition of juvenile salmonids. J. Fish. Res. Board Can., 35: 1359–1363 (1978). 5

