jane12330-sup-0006-AppendixS6
advertisement
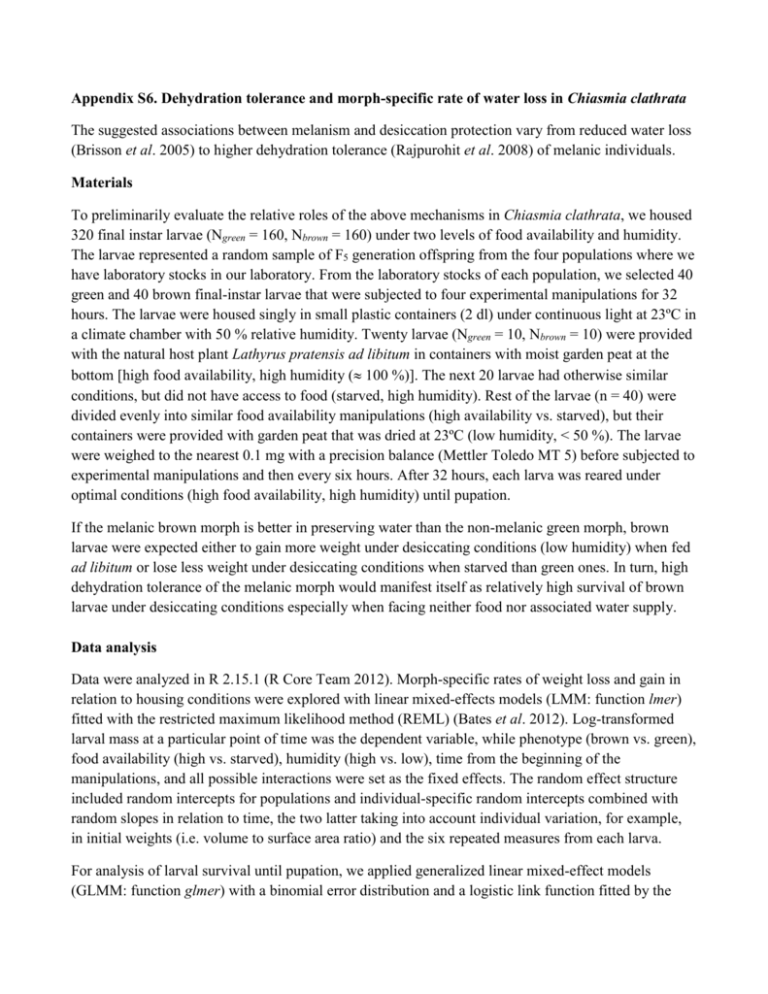
Appendix S6. Dehydration tolerance and morph-specific rate of water loss in Chiasmia clathrata The suggested associations between melanism and desiccation protection vary from reduced water loss (Brisson et al. 2005) to higher dehydration tolerance (Rajpurohit et al. 2008) of melanic individuals. Materials To preliminarily evaluate the relative roles of the above mechanisms in Chiasmia clathrata, we housed 320 final instar larvae (Ngreen = 160, Nbrown = 160) under two levels of food availability and humidity. The larvae represented a random sample of F5 generation offspring from the four populations where we have laboratory stocks in our laboratory. From the laboratory stocks of each population, we selected 40 green and 40 brown final-instar larvae that were subjected to four experimental manipulations for 32 hours. The larvae were housed singly in small plastic containers (2 dl) under continuous light at 23ºC in a climate chamber with 50 % relative humidity. Twenty larvae (Ngreen = 10, Nbrown = 10) were provided with the natural host plant Lathyrus pratensis ad libitum in containers with moist garden peat at the bottom [high food availability, high humidity ( 100 %)]. The next 20 larvae had otherwise similar conditions, but did not have access to food (starved, high humidity). Rest of the larvae (n = 40) were divided evenly into similar food availability manipulations (high availability vs. starved), but their containers were provided with garden peat that was dried at 23ºC (low humidity, < 50 %). The larvae were weighed to the nearest 0.1 mg with a precision balance (Mettler Toledo MT 5) before subjected to experimental manipulations and then every six hours. After 32 hours, each larva was reared under optimal conditions (high food availability, high humidity) until pupation. If the melanic brown morph is better in preserving water than the non-melanic green morph, brown larvae were expected either to gain more weight under desiccating conditions (low humidity) when fed ad libitum or lose less weight under desiccating conditions when starved than green ones. In turn, high dehydration tolerance of the melanic morph would manifest itself as relatively high survival of brown larvae under desiccating conditions especially when facing neither food nor associated water supply. Data analysis Data were analyzed in R 2.15.1 (R Core Team 2012). Morph-specific rates of weight loss and gain in relation to housing conditions were explored with linear mixed-effects models (LMM: function lmer) fitted with the restricted maximum likelihood method (REML) (Bates et al. 2012). Log-transformed larval mass at a particular point of time was the dependent variable, while phenotype (brown vs. green), food availability (high vs. starved), humidity (high vs. low), time from the beginning of the manipulations, and all possible interactions were set as the fixed effects. The random effect structure included random intercepts for populations and individual-specific random intercepts combined with random slopes in relation to time, the two latter taking into account individual variation, for example, in initial weights (i.e. volume to surface area ratio) and the six repeated measures from each larva. For analysis of larval survival until pupation, we applied generalized linear mixed-effect models (GLMM: function glmer) with a binomial error distribution and a logistic link function fitted by the maximum likelihood method (Bates et al. 2012). Status of each individual at pupation (pupated vs. dead) was the dependent variable, while phenotype (brown vs. green), food availability (high vs. starved), humidity (high vs. low), and all possible interactions were set as the fixed effects. Initial mass of a larva was considered as a covariate, random effects including random intercepts for populations. Bayesian Information Criterion (BIC) was used to determine the final structures of fixed effects, an approach that avoids overfitting by penalising increasing numbers of model parameters. To overcome the challenges in determining the degrees of freedom and significances of model parameters in a mixed model framework (see Baayen et al. 2008), we used Markov chain Monte Carlo (MCMC) methods to recalculate parameter estimates and derive their 95 % highest posterior density (HPD) credibility intervals [function HPDinterval (Plummer et al. 2006)] based on the posterior distributions in the LMM analyses. We applied the function MCMCglmm (Hadfield 2012) that fits generalized linear mixed models (equivalent to the final LMMs) to the data with emphasis on correlated random effects. The required prior distributions of variance components were derived from the REML estimates of the final LMM so that the LMM point estimates were set as the expected values of the prior distributions that were defined to be uninformative inverse Wishart distributions by setting low degrees of belief parameters (υresidual = 1, υindividual = 1, υtime:individual = 3). A total of 350 000 MCMC iterations were ran. The burn-in period consisted of 50 000 iterations, and the remaining 300 000 iterations were sampled with a thinning interval of 50. This resulted in posterior distributions of 6000 observations. Results Larvae with a high initial weight survived better until pupation than lighter ones (Table S6.2a). Larval survival was also dependent on ambient humidity and food availability. Survival decreased as a response to low humidity, the response being less pronounced under continuous 0.05 0.03 0.01 Proportional change in log (mass) According to the final model (ΔBIC = 13.0), both ambient humidity and food availability affected temporal change in larval weight (Table S6.1). In contrast to fed larvae, starved ones lost weight during the observation period of 32 hours (Fig. S6.1). Low humidity, in turn, clearly accelerated weight loss among starved larvae and tended to decelerate weight gain among fed ones. Yet, the responses to starvation and drought were independent of larval phenotype (Table S6.1). -0.01 -0.03 -0.05 Melanic (starved, high humidity) -0.07 Non-melanic (starved, high humidity) Melanic (starved, low humidity) -0.09 Non-melanic (starved, low humidity) Melanic (fed, high humidity) Non-melanic (fed, high humidity) -0.11 Melanic (fed, low humidity) Non-melanic (fed, low humidity) -0.13 0 6 12 18 24 30 Time (h) Fig. S6.1. Fitted regression lines for relative mass change from the initial weight of melanic and non-melanic Chiasmia clathrata larvae under different food availability and ambient humidity as a function of time. Table S6.1. Fixed effects of the final LMM explaining variation in log-transformed larval mass in relation to time, phenotype (green / brown), food availability (high / starved) and ambient humidity (high / low). For parameter estimates of the final model, we derived point estimates and 95 % HPD credibility intervals with the Markov chain Monte Carlo sampler MCMCglmm (Hadfield 2012). Parameters, whose HPD credibility intervals do not include zero, are considered statistically significant. The random effect structure included random intercepts for each population (N = 4) as well as individual-specific random intercepts combined with random slopes in relation to time. Linear mixed-effect model Estimate S.E. t Larval mass Intercept Food availability (high) Humidity (low) Time Food availability (high) × Humidity (low) Food availability (high) × Time Humidity (low) × Time Food availability (high) × Humidity (low) × Time 1.51 0.05 0.03 -1.4×10⁻³ -0.03 0.02 0.02 0.02 9.3×10⁻⁵ 0.03 63.28 2.45 1.43 -14.98 -1.03 MCMC simulation Posterior Lower mean bound 1.51 1.45 0.05 7.7×10⁻³ 0.03 -9.1×10⁻³ -3 -1.4×10 -1.6×10-3 -0.03 -0.08 2.2×10⁻³ 1.4×10⁻⁴ 16.11 2.2×10⁻³ 1.9×10⁻³ 2.5×10⁻³ -6.6×10⁻⁴ 5.4×10⁻⁴ 1.3×10⁻⁴ 1.9×10⁻⁴ -4.97 2.82 -6.3×10⁻⁴ 5.7×10⁻⁴ -9.1×10⁻⁴ 1.7×10⁻⁴ -3.9×10⁻⁴ 9.3×10⁻⁴ Upper bound 1.57 0.08 0.06 -1.2×10⁻³ 0.02 Proportion alive at pupation food supply as indicated by the 0.75 significant Food availability × Humidity interaction in the final model 0.65 (ΔBIC = 5.4) (Table S6.2a, Fig. S6.2). The expected response of melanic brown larvae tolerating dehydration 0.55 better than non-melanic green ones did not appear as any interaction term 0.45 including larval phenotype did not enter the final model (Table S6.2a). 0.35 Yet, brown larvae did seemingly better Melanic (fed) than green ones, especially when Non-melanic (fed) 0.25 Melanic (starved) starved under desiccating conditions Non-melanic (starved) (starved, low humidity) (Fig. S6.2). 0.15 The relatively high dehydration high low tolerance of melanic larvae is Humidity implicitly supported by LMMs applied Fig. S7.2. Proportions of melanic and non-melanic Chiasmia clathrata separately to data on either starved or larvae alive at pupation. fed larvae. Among larvae that enjoyed continuous food supply, only the positive effect of initial weight on larval survival entered the final model (ΔBIC = 4.6) (Table S6.2b), whereas only a marginally non-significant Humidity × Phenotype interaction appeared among larvae that were subjected to starvation for 32 hours (ΔBIC = 1.5) (Table S6.2c). Table S6.2. Fixed effects of the final GLMMs explaining variation in larval survival in relation to environmental conditions. In the first case (a), the whole data were used with fixed effects initially including food availability (high / starved), ambient humidity (high / low), larval phenotype (green / brown) and all possible interactions among them, and initial larval mass as a covariate. In (b) and (c), respective subsets of the data including either larvae fed ad libitum or starved for 32 hours were applied. In (b) and (c), the initial models included ambient humidity (high / low), larval phenotype (green / brown) and interaction between them as fixed effects, and initial larval mass as a (fixed) covariate. Each model included random intercepts for populations. Dataset (a) all Parameter Intercept Food availability (high) Humidity (low) Mass Food availability (high) × Humidity (low) Estimate -2.53 0.23 -1.14 0.08 1.05 S.E. 0.64 0.38 0.39 0.02 0.53 Z -3.97 0.62 -2.91 5.01 1.96 P 7.35×10⁻⁵ 0.53 3.61×10⁻³ 5.58×10⁻⁷ 0.048 (b) fed Intercept Mass -1.17 0.05 0.81 0.02 -1.45 2.44 0.147 0.015 (c) starved Intercept Humidity (low) Phenotype (green) Mass Humidity (low) × Phenotype (green) -4,29 -0.66 0.21 0.12 -1.54 1.12 0.57 0.57 0.03 0.86 -3.84 -1.16 0.37 4.41 -1.80 1.22×10⁻⁴ 0.247 0.709 1.03×10⁻⁵ 0.061 Conclusions We did not find support for the reduced water loss associated with melanism as both brown and green larvae either gained or lost weight at similar rates depending on the level of food supply. Possibly, melanic larvae tolerate dehydration better than non-melanic ones as brown larvae seemingly recovered from ephemeral drought better than green ones in terms of survival. References Baayen, R.H., Davidson, D.J. & Bates, D.M. (2008) Mixed-effects modeling with crossed random effects for subjects and items. Journal of Memory and Language, 59, 390–412. Bates, D., Maechler, M. & Bolker, B. (2012) lme4: Linear mixed-effects models using S4 classes. R Package, Version 0.999999-0. Available at: http://cran.r-project.org/ Brisson, J.A., De Toni, D.C., Duncan, I. & Templeton, A.R. (2005) Abdominal pigmentation variation in Drosophila polymorpha: geographic variation in the trait, and underlying phylogeography. Evolution, 59, 1046–1059. Hadfield, J. (2012) MCMCglmm: MCMC generalised linear mixed models. R Package, Version 2.17. Available at http://cran.r-project.org/ Plummer, M., Best, N., Cowles, K. & Vines, K. (2006) CODA: Convergence Diagnosis and Output Analysis for MCMC. R News, 6, 7–11. Rajpurohit, S., Parkash, R. & Ramniwas, S. (2008) Body melanisation and its adaptive role in thermoregulation and tolerance against desiccating conditions in drosophilids. Entomological Research, 38, 49–60. R Core Team (2012) R: A language and environment for statistical computing. Version 2.15.1. R Foundation for Statistical Computing, Vienna, Austria. Available at: http://www.r-project.org/
