CP PHYSICS Name: Investigating Waves Lab ___ period Objective
advertisement
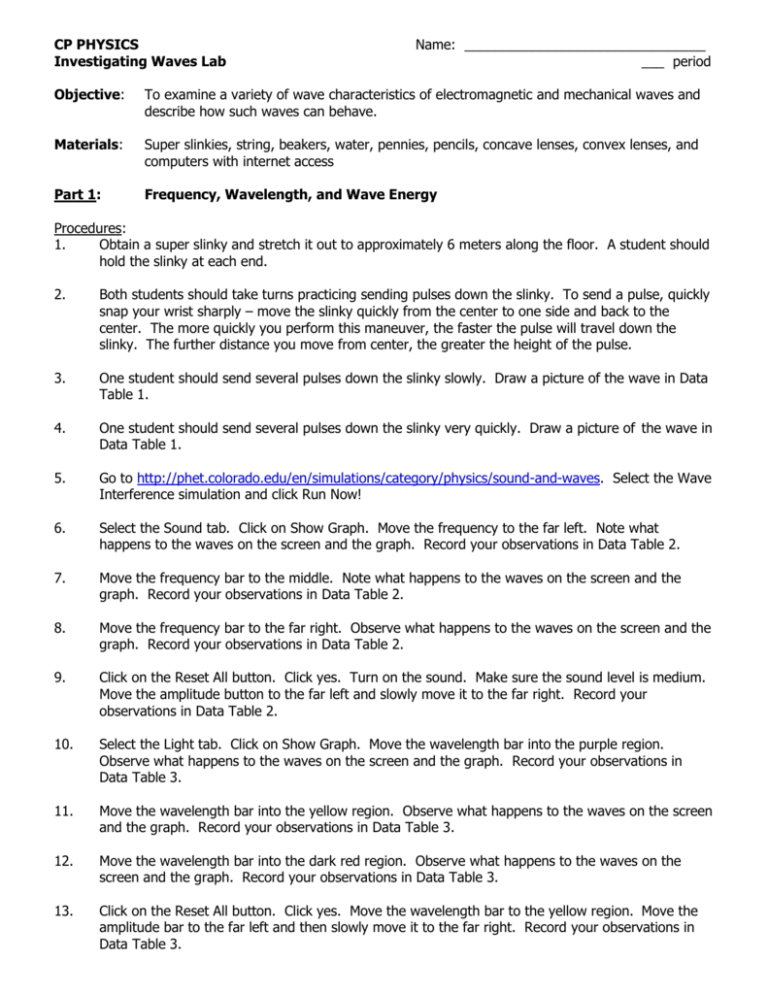
CP PHYSICS Investigating Waves Lab Name: ________________________________ ___ period Objective: To examine a variety of wave characteristics of electromagnetic and mechanical waves and describe how such waves can behave. Materials: Super slinkies, string, beakers, water, pennies, pencils, concave lenses, convex lenses, and computers with internet access Part 1: Frequency, Wavelength, and Wave Energy Procedures: 1. Obtain a super slinky and stretch it out to approximately 6 meters along the floor. A student should hold the slinky at each end. 2. Both students should take turns practicing sending pulses down the slinky. To send a pulse, quickly snap your wrist sharply – move the slinky quickly from the center to one side and back to the center. The more quickly you perform this maneuver, the faster the pulse will travel down the slinky. The further distance you move from center, the greater the height of the pulse. 3. One student should send several pulses down the slinky slowly. Draw a picture of the wave in Data Table 1. 4. One student should send several pulses down the slinky very quickly. Draw a picture of the wave in Data Table 1. 5. Go to http://phet.colorado.edu/en/simulations/category/physics/sound-and-waves. Select the Wave Interference simulation and click Run Now! 6. Select the Sound tab. Click on Show Graph. Move the frequency to the far left. Note what happens to the waves on the screen and the graph. Record your observations in Data Table 2. 7. Move the frequency bar to the middle. Note what happens to the waves on the screen and the graph. Record your observations in Data Table 2. 8. Move the frequency bar to the far right. Observe what happens to the waves on the screen and the graph. Record your observations in Data Table 2. 9. Click on the Reset All button. Click yes. Turn on the sound. Make sure the sound level is medium. Move the amplitude button to the far left and slowly move it to the far right. Record your observations in Data Table 2. 10. Select the Light tab. Click on Show Graph. Move the wavelength bar into the purple region. Observe what happens to the waves on the screen and the graph. Record your observations in Data Table 3. 11. Move the wavelength bar into the yellow region. Observe what happens to the waves on the screen and the graph. Record your observations in Data Table 3. 12. Move the wavelength bar into the dark red region. Observe what happens to the waves on the screen and the graph. Record your observations in Data Table 3. 13. Click on the Reset All button. Click yes. Move the wavelength bar to the yellow region. Move the amplitude bar to the far left and then slowly move it to the far right. Record your observations in Data Table 3. CP PHYSICS, Investigating Waves Lab, page 2 Data: Table 1 Pulses Slow pulses Observations (picture of wave) Fast pulses Table 2 Sound waves Observations Low frequency Medium frequency High frequency Amplitude Table 3 Light waves Purple Yellow Dark Red Amplitude Observations CP PHYSICS, Investigating Waves Lab, page 3 Analysis and Conclusions: 1. What happened to the wavelengths of your pulses when you went from slow pulses to fast pulses? 2. What happened to the wavelengths of the sound waves when the frequency of the waves increased? 3. What happened to the sound when you moved the amplitude button from left to right? 4. Which color of light had the smallest wavelength? Which color of light had the longest wavelength? 5. What happened to the frequencies of the light waves when the wavelength of the waves increased? 6. What happened to the light when you moved the amplitude button from left to right? 7. What is the relationship between frequency and wavelength for a wave? Does this relationship apply to all types of waves? Explain. 8. What does the frequency and amplitude of a wave indicate about the wave’s energy? CP PHYSICS, Investigating Waves Lab, page 4 Part 2: Reflection Procedures: 1. Obtain a super slinky and stretch it out to approximately 6 meters along the floor. A student should hold the slinky at each end. 2. One student should hold the end of the slinky against a textbook. The other student should send a quick, tall pulse down the slinky. Observe what happens to the wave as it travels down to the textbook and then returns. Record your observations in Data Table 1. 3. One student should loop the string through a coil of the slinky and hold both ends of the string together. The other student should send a quick, tall pulse down the slinky. Observe what happens to the wave as it travels down to the end with the string and then returns. Record your observations in Data Table 1. 4. Go to http://phet.colorado.edu/en/simulations/category/physics/sound-and-waves. Select the Wave on a String simulation and click Run Now! 5. Select pulse, 50 amplitude, 50 pulse width, 0 damping, high tension, and fixed end. Click on pulse and watch what happens to the wave. Record your observations in Data Table 2. 6. Click restart. Keeping all other properties the same, click on loose end. Click on pulse and watch what happens to the wave. Record your observations in Data Table 2. Data: Table 1 Slinky Waves Reflection off of textbook Observations Reflection off of string Table 2 Waves on a String Reflection off of a fixed end Reflection off of a loose end Observations CP PHYSICS, Investigating Waves Lab, page 5 Analysis and Conclusions: 1. What happens to a wave when it strikes a rigid boundary? 2. What happens to a wave when it strikes a flexible boundary? Part 3: Refraction Procedures: 1. Fill a beaker with water. Place a penny in the beaker. Place another penny right next to the outside of the beaker. View both coins from above the top of the beaker. How far down do the pennies appear to you? Record your observations in Data Table 1. 2. Place a pencil into the beaker. Look down on the pencil from above the beaker and record your observations in Data Table 1. Look at the pencil from the side of the beaker and record your observations in Data Table 1. 3. Look at the procedures to this minilab through the concave lens. The concave lens is the lens with the thin center and thicker edges. Draw a picture in Data Table 2 showing how the text appears in the lens. 4. Look at the procedures of this minilab through the convex lens. The convex lens is the lens with the thicker center and thin edges. Draw a picture in Data Table 2 showing how the text appears in the lens. Data: Table 1 Beaker w/water Coins in beaker and next to beaker Pencil from top of beaker Pencil from side of beaker Observations CP PHYSICS, Investigating Waves Lab, page 6 Table 2 Lenses Observations Text seen through a concave lens Text seen through a convex lens Analysis and Conclusions: 1. Does light continue to travel in a straight line as it moves from the air and through the water in the beaker? Support your answer with your observations. 2. What do concave lenses do? What would a practical use of these lenses be? 3. What do convex lenses do? What would a practical use of these lenses be? Part 4: Diffraction Procedures: 1. Go to http://www.acoustics.salford.ac.uk/feschools/waves/diffract.htm . Complete the first box activity between sight and sound. Record your observations and the information given in the activity in Data Table 1. 2. Continue down the page and perform the “Diffraction around an Object” activity. Record your observations for each object in Data Table 2. 3. Continue reading down the page and answer the four questions. Record the correct statements in Data Table 3. Finish reading the rest of the page. CP PHYSICS, Investigating Waves Lab, page 7 Data: Table 1 Sight vs. Sound Observations & Information Sight Sound Table 2 Object Observations Large Object Medium Object Small Object Table 3 Question Information 1 2 3 4 CP PHYSICS, Investigating Waves Lab, page 8 Analysis and Conclusions: 1. Why can you hear someone talking in the next room even though you cannot see them? 2. Which type of sounds will be the loudest when heard by diffraction? Which will be the quietest? 3. What factors are important in determining if a wave will be able to diffract around an object or barrier? Part 5: Wave Interference Procedures: 1. Obtain a super slinky and stretch it out to approximately 6 meters along the floor. A student should hold the slinky at each end. 2. Both students should practice sending pulses at the same time. Practice sending them from the same sides and from opposite sides. (Same side – snap wrists in the same direction from center, opposite side – snap wrists in opposite direction from center) 3. Both students should send a quick, tall pulse from the same side. Watch what happens when both pulses meet. Repeat the process, if necessary, to make a complete observation. Record your observations of what happens in Data Table 1. 4. Both students should send a quick, tall pulse from opposite sides. Watch what happens when both pulses meet. Repeat the process, if necessary, to make a complete observation. Record your observations of what happens in Data Table 1. 5. Go to http://phet.colorado.edu/en/simulations/category/physics/sound-and-waves. Select the Wave Interference simulation and click Run Now! 6. Click on the Sound tab. Click on the green box with the plus to enlarge the screen. Click on two speakers and set the spacing at 50 cm. Move the frequency bar to the middle. Finally click on the add detector. The detector should appear with a moving graph of the sound pressure and have a target box attached to it. The target box moves and you can place it on various locations to see what the sound pressures look like at different places in the wave pattern. 7. Move the target box to measure the wave pressure at one of the speakers. Place it directly in front of the wave coming from the speaker - just to the right of the center of the wave. Observe what the detector graph shows for the wave pressure. Draw this observation into Data Table 2. CP PHYSICS, Investigating Waves Lab, page 9 8. Move the target box to measure the wave pressure in the waves further to the right of the screen where sound waves from both speakers are combining. Draw the detector’s graph results in Data Table 2. 9. Move the target box to measure the wave pressure in one of the places where no waves appear – they should look like long gray lines. Draw the detector’s graph results in Data Table 2. 10. Click on the Light tab. Click on the green box with the plus to enlarge the screen. Click on two lights and set the spacing at 2100 nm. Finally click on the add detector. This will give you a detector just like the one used with the Sound tab. 11. Move detector’s target box near one of the light sources – but not right at the source. Draw the results shown on the detector into Data Table 3. 12. Move the target box into the combined waves from both light sources. Draw the results shown on the detector into Data Table 3. 13. Move the target box into an area where no waves are combined – it looks like a line through the waves. Draw the results shown on the detector into Data Table 3. 14. Go to http://phet.colorado.edu/en/simulations/category/physics/sound-and-waves. Select the Sound simulation and click Run Now! 15. Click on the Two Source Interference tab. Click on the audio enabled box to turn on the sound. Move the man’s head back and forth through the combined waves. Observe what happens to the sound level as his ears move through the combined waves to the area where no waves appear. Record you observations in Data Table 4. Data: Table 1 Pulses Same side pulses Observations Opposite side pulses Table 2 Sound Waves near one speaker Combined waves Region between combined waves Observations (Picture of Detector Results) CP PHYSICS, Investigating Waves Lab, page 10 Table 3 Light Observations (Picture of Detector Results) Waves near one speaker Combined waves Region between combined waves Table 4 Sound level Observations Combined waves No waves Analysis and Conclusions: 1. What happens to the combined waves on the slinky when they are on the same side? 2. What happens to the combined waves on the slinky when they are on the opposite side? 3. What did the detector show about waves from two sources and how they can interfere with each other? 4. What happens to the sound levels when you move from a region where the two speakers’ waves are combining as compared to the areas where no combined waves appear?


