btpr1743-sup-0001
advertisement
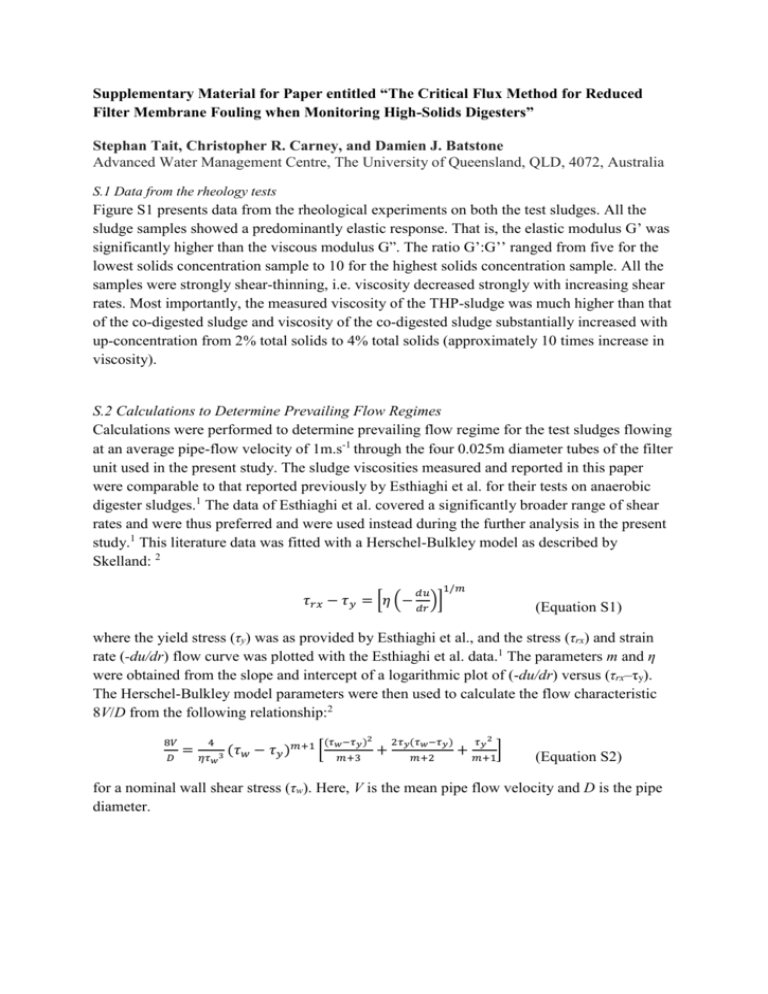
Supplementary Material for Paper entitled “The Critical Flux Method for Reduced Filter Membrane Fouling when Monitoring High-Solids Digesters” Stephan Tait, Christopher R. Carney, and Damien J. Batstone Advanced Water Management Centre, The University of Queensland, QLD, 4072, Australia S.1 Data from the rheology tests Figure S1 presents data from the rheological experiments on both the test sludges. All the sludge samples showed a predominantly elastic response. That is, the elastic modulus G’ was significantly higher than the viscous modulus G”. The ratio G’:G’’ ranged from five for the lowest solids concentration sample to 10 for the highest solids concentration sample. All the samples were strongly shear-thinning, i.e. viscosity decreased strongly with increasing shear rates. Most importantly, the measured viscosity of the THP-sludge was much higher than that of the co-digested sludge and viscosity of the co-digested sludge substantially increased with up-concentration from 2% total solids to 4% total solids (approximately 10 times increase in viscosity). S.2 Calculations to Determine Prevailing Flow Regimes Calculations were performed to determine prevailing flow regime for the test sludges flowing at an average pipe-flow velocity of 1m.s-1 through the four 0.025m diameter tubes of the filter unit used in the present study. The sludge viscosities measured and reported in this paper were comparable to that reported previously by Esthiaghi et al. for their tests on anaerobic digester sludges.1 The data of Esthiaghi et al. covered a significantly broader range of shear rates and were thus preferred and were used instead during the further analysis in the present study.1 This literature data was fitted with a Herschel-Bulkley model as described by Skelland: 2 𝑑𝑢 1/𝑚 𝜏𝑟𝑥 − 𝜏𝑦 = [𝜂 (− 𝑑𝑟 )] (Equation S1) where the yield stress (τy) was as provided by Esthiaghi et al., and the stress (τrx) and strain rate (-du/dr) flow curve was plotted with the Esthiaghi et al. data.1 The parameters m and η were obtained from the slope and intercept of a logarithmic plot of (-du/dr) versus (τrx–τy). The Herschel-Bulkley model parameters were then used to calculate the flow characteristic 8V/D from the following relationship:2 8𝑉 𝐷 4 = 𝜂𝜏 𝑤 3 (𝜏𝑤 − 𝜏𝑦 )𝑚+1 [ (𝜏𝑤 −𝜏𝑦 )2 𝑚+3 + 2𝜏𝑦 (𝜏𝑤 −𝜏𝑦 ) 𝑚+2 𝜏𝑦 2 + 𝑚+1] (Equation S2) for a nominal wall shear stress (τw). Here, V is the mean pipe flow velocity and D is the pipe diameter. Figure S1. Example data for rheological measurements, including strain sweeps at a constant frequency (10 rad.s-1) and frequency sweeps at a constant amplitude for (a) codigested sludge with 2% total solids by wet mass, (b) co-digested sludge upconcentrated to 4.0% total solids, and (c) digestate of thermally hydrolyzed waste activated sludge (THP-sludge) at 3.3% total solids. Frequency sweeps were performed at an amplitude of 1% for (a), (b) and (c) and 0.1% for (d). Measurements for (a) and (b) were performed at 38°C, and for (c) at 37°C. At the very lowest strain amplitudes for (a), the measured torque fell outside of the validity range for the instrument, so data are not presented at these low strain amplitudes. The linear visco-elastic region extended to around 1% strain amplitude for the co-digested sludge samples, and 0.1% for the THP-sludge, and these upper limits were selected for the frequency sweeps at constant amplitude, in order to maximise the measured torque/accuracy of the results. Note the logarithmic axes. Continuation of S.2.: The relationship between τw and 8V/D in-turn provided K’ and n’ as fitting parameters for the relationship:2 8𝑉 𝑛′ 𝜏𝑤 = 𝐾′ ( 𝐷 ) (Equation S3) where n’ was estimated from:2 𝑛′ = 𝑑 ln(𝜏𝑤 ) 8𝑉 ) 𝐷 (Equation S4) 𝑑 ln( and K’ was determined for each value of τw.2 The generalized Reynold’s number (NRe,gen):2 𝑁𝑅𝑒,𝑔𝑒𝑛 = 𝐷 𝑛′ 𝑉 2−𝑛′ 𝜌 ′ 𝐾′8𝑛 −1 (Equation S5) was then calculated for each pair of V, K’ and n’ and the value of V corresponding to a NRe,gen = 2100 was taken to be the transition velocity from laminar flow to transition-to-turbulent.2 The sludge matrix density, ρ, was assumed to be equal to that of liquid water (1000 kg/m3). Table S1 illustrates the calculation sequence for the sludge tested by Esthiaghi et al. which had the lowest solids concentration (3.17% wet basis, τy=1.04 Pa).1 Table S1. Illustrated calculations using rheology data of Esthiaghi et al. measured for an anaerobic digester sludge of solids content 3.17% wet basis and an estimated yield stress of τy=1.04 Pa.1 Shear rate -du/dr (s-1) ln(-du/dr) Shear stress (Pa) ln(τrx–τy) 10 2.30 1.20 -1.83 20 3.00 1.32 -1.26 30 3.40 1.44 -0.92 40 3.69 1.55 -0.68 50 3.91 1.65 -0.50 105 4.65 2.16 0.11 160 5.08 2.63 0.46 320 5.77 3.86 1.04 490 6.19 5.05 1.39 Figure S1 presents a logarithmic plot of (-du/dr) versus (τrx–τy) for the data of Table S1. The parameters m and η were determined from the slope and intercept shown in the figure. Figure S1. A logarithmic plot of (-du/dr) versus (τrx–τy) for data of a sludge tested by Esthiaghi et al.,1 which had a solids concentration of 3.17% wet basis and estimated yield stress, τy=1.04 Pa. Table S2 presents the remainder of the calculations for the same sludge as Table S1 flowing through the 25mm tubes of the filter unit used in the present work. The results suggested that the transition velocity (Re=2100) for this sludge would be between 2.25 and 2.3m.s-1 (well above the 1m.s-1 flow in the present study). Table S2. Continued illustrated calculations for the rheology data of Esthiaghi et al.,1 for an anaerobic digester sludge of solids content 3.17% wet basis and an estimated yield stress of τy=1.04 Pa. V 8V/D τw (Pa) ln(τw) ln(8V/D) d ln(τw) (8V/D) n' K' 8V/Da NRe,genb (m/s) (guess) /d ln(8V/D) (recalculated) 0.9 288 9.8 2.3 5.7 0.717 58 0.17 288 660 1 320 10.6 2.4 5.8 0.731 68 0.16 320 750 2.1 672 18.5 2.9 6.5 0.767 148 0.13 672 1910 2.2 704 19.1 3.0 6.6 0.769 154 0.12 704 2030 2.25 720 19.5 3.0 6.6 0.770 158 0.12 720 2080 2.3 736 19.8 3.0 6.6 0.771 162 0.12 736 2140 2.4 768 20.5 3.0 6.6 0.640 70 0.29 768 2250 a Calculated with Equation S2 b Calculated with Equation S5 However, co-digested sludge tested in the present work had a lower solids concentration (2% total solids) than the sludge with the lowest solids content tested by Esthiaghi et al. (3.17% total solids).1 To confirm the prevailing flow regime for the 2% solids co-digested sludge flowing through the 25mm filter tubes, empirical correlations provided by Esthiaghi et al. were used to estimate the relevant Herschel-Bulkley model parameters for a hypothetical sludge with the same solids content as the co-digested sludge,1 and then the sequence of calculations outlined above were repeated. Table S3 provides the Herschel-Bulkley model parameters (K, n and τy) together with calculated generalized Reynold’s numbers for pipeflow of all the sludges of Esthiaghi et al. and the 2% solids hypothetical sludge (argued to be similar to the co-digested sludge) at 1m.s-1 flow velocity through the 25mmm filter tubes. All the calculated Reynold’s numbers were sufficiently low (<<2100) to conclude that laminar flow conditions prevailed during the filtration tests of the present study. Table S3. Calculated general Reynold’s number values for the sludges tested by Esthiaghi et al. 1, if they were to flow through a 25mm tube at 1m.s-1 Total solids (% weight percent wet basis) τy (Pa) K (Pa.sn) n NRe,gen Lowest solids concentrationa 3.17 1.04 0.0239 0.827 750 Medium solids concentrationa 4.66 3.13 0.240 0.632 280 Highest solids concentrationa 6.62 12.0 0.366 0.664 131 Hypothetical Sludgeb 2 0.999 1086 Description 0.265 0.00548 a Herschel-Bulkley parameters were as provided by Esthiaghi et al.1 b Values for τy, K and n were calculated using the empirical correlations provided by Esthiaghi et al.1 The flow curve was then estimated and the further analysis was carried out for this hypothetical sludge. References 1. 2. Eshtiaghi, N.; Markis, F.; Slatter, P., The laminar/turbulent transition in a sludge pipeline. Water Sci Technol 2012, 65, (4), 697-702. Skelland, A. H. P., Non-Newtonian flow and heat transfer. Wiley: New York, 1967; p 469.

![Self-supply treatment & disposal register [Year] [A Wastewater](http://s3.studylib.net/store/data/006661037_1-a87e10c3ed3f726a249f6a80d49c5650-300x300.png)


