SY4 Research Methods Booklet
advertisement
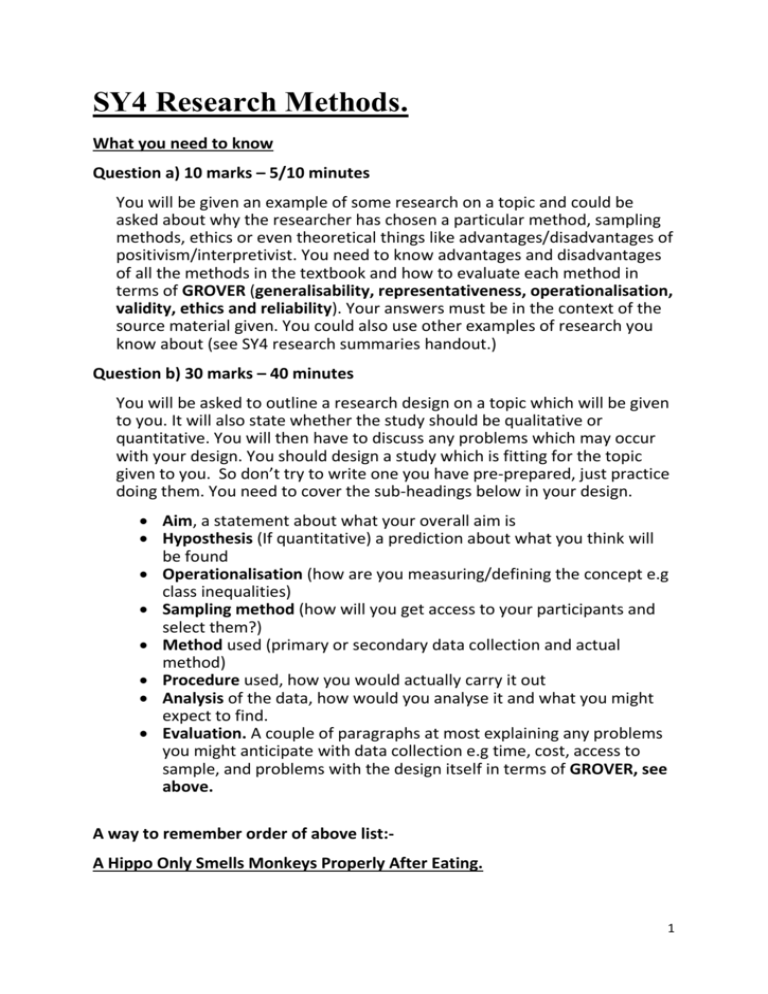
SY4 Research Methods. What you need to know Question a) 10 marks – 5/10 minutes You will be given an example of some research on a topic and could be asked about why the researcher has chosen a particular method, sampling methods, ethics or even theoretical things like advantages/disadvantages of positivism/interpretivist. You need to know advantages and disadvantages of all the methods in the textbook and how to evaluate each method in terms of GROVER (generalisability, representativeness, operationalisation, validity, ethics and reliability). Your answers must be in the context of the source material given. You could also use other examples of research you know about (see SY4 research summaries handout.) Question b) 30 marks – 40 minutes You will be asked to outline a research design on a topic which will be given to you. It will also state whether the study should be qualitative or quantitative. You will then have to discuss any problems which may occur with your design. You should design a study which is fitting for the topic given to you. So don’t try to write one you have pre-prepared, just practice doing them. You need to cover the sub-headings below in your design. Aim, a statement about what your overall aim is Hyposthesis (If quantitative) a prediction about what you think will be found Operationalisation (how are you measuring/defining the concept e.g class inequalities) Sampling method (how will you get access to your participants and select them?) Method used (primary or secondary data collection and actual method) Procedure used, how you would actually carry it out Analysis of the data, how would you analyse it and what you might expect to find. Evaluation. A couple of paragraphs at most explaining any problems you might anticipate with data collection e.g time, cost, access to sample, and problems with the design itself in terms of GROVER, see above. A way to remember order of above list:A Hippo Only Smells Monkeys Properly After Eating. 1 Definitions Primary data: first hand original research (e.g. participant observation, focus group, social surveys) Secondary data : data already collected; used for different reasons such as reanalysis (e.g. official statistics) Quantitative: data that is largely numerical in form(e.g. large scale social survey) Qualitative: data consisting of words/meaning/interpretations (e.g. participant observation) Positivist: objectivity, causes, reliability, sociology should be scientific Interpretivist : sociology and research should report on how people understand the world (meanings) Validity: does the data provide a true picture of what is being studied or measured? Are the findings an accurate account of social reality? Reliability: the extent to which repeated measurements, under the same conditions, produce the same results. If other researchers using the same methods, under the same conditions, produced the same results then the data is reliable. How constant are the findings? Quantitative methods often lack validity but are often reliable. Qualitative methods are criticised for being unreliable. Representativeness: Is the group of people being studied typical of others? Sampling techniques are important in gaining a representative group of participants. Random techniques are used to quantitative research and non-random for qualitative. Target population: The group of people being studied e.g young offenders Sampling frame: A representative list of people from the target population from which the sample will be drawn e.g young offenders institutions Random sample: participants are selected randomly by computer or by hand e.g from a hat, this ensures every person in the frame has an equal chance of being selected Stratified random sample: the sample frame is separated into strata e.g gender, age, ethnicity and then random samples are drawn separately from the stata to ensure a representative sample 2 Systematic sampling: the first participant is drawn at random and then every nth (5th or 10th etc) is drawn after that. Quota sampling: Non-random as it involves the researcher selecting a quota of groups e.g gender from the sampling frame. Snowball sampling: used when participants are difficult to access e.g gang members. One contact asks friends if they will take part and the friends ask more friends and so on. This is non-random. Purposive sampling: non-random, selecting a groups of people for a specific purpose e.g Car workers in Luton. Gatekeepers : These are the people who work in institutions like education or a care home that can facilitate access to a group of participants e.g school children or disabled people. Generalisability: can the findings from one setting be applied to similar settings? Are the findings from a study of student drug users in London similar to findings if we studied drug users in Manchester? Bias: distortion of results; difference from true value Hawthorne effect: When participants behave differently because they know they are being observed. Objective: to what extent is the research value free and a reflection of reality? Operationalisation : Expressing a concept in a way that can be measured. For example; it is pointless to talk about social class if no indicator of what social class means is provided. The basic point is sound; if you cannot define something then you cannot measure it. Ethical issues: involve informed consent, deception,confidentiality, protection from harm, right to withdraw. Practical issues: Time, cost, practicality of method, availability of sample, funding, going native. Methods Social Survey: a quantitative study on a large scale to find information regarding issues like crime, attitudes, habits etc- uses questionnaires or face to face structured interviews. Questionnaire: requires respondents to answer in writing – can be large scale or small, open or closed questions but are usually quantitative. Interviews: Face to face interaction between researcher and interviewee. Can be structured and quantitative or semi-structured or unstructured which are qualitative. 3 Observations: observing groups or individuals either from afar (covert) or with their consent (overt). Can be structured and quantitative or qualitative as in participant observation where the researcher becomes part of the group. Experiments: Not usually done in Sociology although there are some examples. Can be laboratory (in a closed environment) or field (in a natural setting) Involves manipulating and controlling variables such as gender to see the effect on behaviour. I.e do people behave differently towards baby boys or girls. Statistical data: form of secondary, quantitative data used to gather numerical data on phenomena e.g GCSE results. Content Analysis: usually quantitative data collecting by analysing the content of media publications, tv shows etc e.g How many minutes do women appear in Eastenders compared to men. Focus Groups: uses qualitative methods to explore issues relating to a group e.g community wellbeing. Personal Documents: Include letters, diaries, photographs and are useful for qualitative research particularly for Historical comparisons. Longitudinal studies: conducted over a long period of time comparing data from participants to see changes. Can be quantitative or qualitative. Pilot Studies: Only carried out on quantitative studies to test quality of questions for questionnaires or interviews- checks validity and reliability before a large scale study is done. Case Studies: carried out on individuals or small groups – in depth account of their stories so is qualitative. Mixed methods:Triangulation - several different methods are used to conduct the same study so that the reliability and validity can be checked. Methodological Plurism - the use of mixed methods to conduct one single study. Example Question and design. As an A level Sociologist, you have been asked to discover whether old people feel that they are the subjects of age discrimination in the UK. Suggest a simple research design and justify your choices. Explain the difficulties that you might experience in carrying out your design and suggest how you would avoid them. 4 Aim This quantitative study would aim to collect primary data to discover the extent of age discrimination in the UK by asking a sample of older people about their experiences and perceptions. I have chosen to use a quantitative study as I will be able to discover statistically whether a high proportion of the sample feel they have been discriminated against. Hypothesis The percentage of older people who feel they have experienced age discrimination in the uk will be lower than those who feel they have not. Operationalisation For the purpose of this study ‘old people’ will people who are over 75yrs of age in Torbay. Whether or not those people have been ‘subjects of discrimination’ will be defined as whether or not they feel they have been refused health services, jobs or benefits on the basis of their age. Sample The sampling frame would be anyone over age 75. The study will use random sampling as this is appropriate for a quantitative study. A random sample of 100 participants who are over 75 could be selected by entering names into a computer and using a random generator of names. This could be done via the electoral roll for Torbay. Method The method will be a written questionnaire in survey format using closed yes or no questions. Using this method will make it easier to analyse the results and discover the numbers of people who feel they have been discriminated against on the various issues. Using this method as opposed to interviews would also cut down the cost and time consumed. Procedure First I would need to design my questionnaire considering validity, reliability and ethics, making sure not to ask offensive or ambiguous questions. The questionnaire would ask simple questions such as ‘Have you been refused any 5 health services in the past 5 years ? yes/no’ followed by ‘if yes, do you feel this was due to your age? Yes/no. Next I would contact local government to find out if it was possible to gain a list of all those over 75 on the electoral roll for Torbay or if they could generate a random sample of 100 names for me. Once I had received the list I would conduct a pilot study by randomly selecting out of a bag 5 names of people to post questionnaires to with stamped addressed envelopes. The questionnaire itself would be returned anonymous to protect confidentiality. Once the pilot questionnaires have been received back I would check responses for obvious misunderstandings which may affect validity and make alterations to my questionnaire. I would then post questionnaires to the remaining 95 people and await their responses. Analysis I would analyse the raw data from my study by placing all responses in categories first. Those with all no answers, and those with all or some yes answers. I would work out the percentage of pps who felt they had been discriminated against on any issue. I would then work out which issue was of most concern by finding out the percentage of pps who answered yes for health, jobs and benefits separately. I could then represent this data using a bar chart . I would return to my aim and hypothesis and come to a conclusion about whether age discrimination was a significant issue for the sample of pps involved in the survey. Evaluation Using a positivist approach means that the study would lack qualitative data and therefore I would not gain rich data about the pp’s experiences of discrimination. This means that the study may lack validity. This could be rectified by changing the study to a mixed method approach using some open questions. Another issues related to validity is the questionnaire itself. There may be wording in the questions which leads to misunderstandings and/or encourages pps to give socially acceptable answers which may affect the accuracy and truthfulness of the data. For example they not wish to disclose that they have been refused treatment because they are overweight. This could be dealt with by using the pilot study as suggested or by checking the 6 questionnaire with an experienced Sociologist. The random sample will also be selected only from one small area of the UK and therefore this sample may be too small and specific to generalise to the whole population of over 75s. This could be dealt with by selecting pps from several different parts of the UK. Furthermore the random sample may turn out to be uneven in terms of males and females and the study may therefore lack representativeness of both genders equally. This could be rectified by using a stratified sampling method. Due to the method used it is possible that some pps will not respond to the questionnaire and therefore the actual sample could be even smaller. This could be improved by using interview method but this could be timeconsuming. There is also the time and cost involved in sending out questionnaires with no guarantee of a response and in collating and analysing the data. This could be dealt with by using existing secondary sources in relation to age discrimination but then the data would not be so current. This study uses a positivist approach to research using quantitative methods and primary data. This makes my study more scientific and value-free. It uses random sampling therefore producing a higher probability that the results can be generalised to the wider population of those over 75. The study should have high reliability as the questionnaire uses closed questions making it easily replicable therefore producing consistent data. The study does not involve much inconvenience or offense to the participants and would be anonymous and voluntary and therefore meets ethical guidelines. 7 SY4 - Social Inequality Research summaries In the compulsory section on research methods you might find it useful to refer to existing research to explain your points better. e.g if you are trying to explain why the researcher in the source material has used participant observation, you might refer to Paul Willis’ Learning to Labour study as an additional example. You should also look to include at least one study in your essays in the Social Inequality section where you can evaluate the methods used. This will boost your AO2 marks. Below are some recent examples of research into social inequality and their methods . TASK Try evaluating their methods in term of advantages and disadvantages and GROVER Royal Commission of Distribution of Income Collected official government statistics on income distribution and found that conservative policies have consistently benefitted the wealthy whilst labour government policies have closed equality gap a little these policies were unable to keep up with rise in wealth at the very top e.g footballers and celebrities. Oxford Mobility Study (Goldthorpe and Payne (1986) looks at official employment statistics from census information. No change in social mobility and a continuing practice of elite self-recruitment in upper classes HOWEVER – when women’s income is taken into account instead of just the man in the household the mobility picture is different. Devine (2005) used 50 unstructured interviews with doctors and teachers and found that they were generally not at ease with a middle-class identity and often referred to themselves as working class. The Future Foundation (2006) used statistical data from British Household survey which showed 43% of people in Uk define themselves as middle-class compared to 53% defining themselves as working class and only 1% as upper class. Thiel (2007) used participant observation of builders at a construction site in London. Found that masculine practises of larking about, piss-taking, defying authority was still very strong part of working-class working culture similar to Paul Willis’ findings in Learning to Labour. Shows we cannot separate social class and gender. Jones (1997) used mixed methods of questionnaires and interviews to study causes of the underclass. Focused on young homeless people. Found that circumstances were a mixture of individual choice and structural contraints. 8 Seager (1997) used time diaries to explore time spent on tasks by men and women. Found that women spend more time on domestic chores whilst men more on paid work. Men also had more rest and leisure time. Heth and Yi Cheung (2006) used statistical analysis of existing data and found that there is a greater ethnic penalty (disadvantage) for Pakistanis and Bangladeshis and Caribbean people. Skeggs (1997) used a longitudinal design using qualitative interviews to explore attitudes towards class in females. She found women were consistently concerned with escaping what they saw as people who were not respectable. They sought respectability through going to night classes, wearing particular types of clothing etc. Palmer et al (2006) Monitoring Poverty and Social Exclusion. Used 50 indicators to measure poverty in the UK, used secondary sources see textbook pg 234. Midgley and Bradshaw , Should I stay or should I go. Focus groups and interviews exploring rural youth transitions. Found that many young people have to move away from home town to get a job. This was backed up by 24 semi-structured interviews. September 2005 – release of tv programme series 49UP (from original 7UPLongitudinal study) based on class differences in the UK. Can be watched on the net. Other famous Sociological studies Official Statistics The Census – every household every 10 years. Full picture of population of UK Crime statistics from police/courts, and British Crime survey ‘Suicide’ Emile Durkheim (& J Maxwell Atkinson as criticism) Comparative method ‘Suicide’ Emile Durkheim Questionnaires The Census – closed questions ‘Hite Report’ – Shere Hite – open questions, feminist ‘The Making of a Moonie’ – Eileen Barker British Crime Survey 9 Interviews ‘From here to Maternity’- Anne Oakley – in depth interviews ‘Sociology of Housework’/’Housewife’ – Anne Oakley – structured and in depth interviews ‘Interviewing women – a contradiction in terms’ - Anne Oakley (journal article on feminist views on interviews as a research method) ‘The Making of a Moonie’ Eileen Barker – in depth, interpretivist Experiments Counselling experiment – Harold Garfinkel – field experiment – ethnomethodological ‘Pygmalion in the Classroom’ – Rosenthal and Jacobsen – field experiment interpretivist ‘On being sane in insane places’ – Rosenhan – field experiment – interpretivist Bobo doll experiments – Bandura etc – lab experiments – social psychology Zimbardo Stanford Prison Study Observation ‘Analysing Teaching Behaviour’ – N Flanders – overt, structured, non participant ‘A Glasgow Gang Observed’ – James Patrick – largely covert, participant ‘The Tearoom Trade’ – Laud Humphreys – covert and overt, semi participant ‘Learning to Labour’ – Paul Willis – largely overt, mostly participant ‘The Making of a Moonie’ – Eileen Barker – overt, participant 10 Table to use for revision Quantitative: Qualitative: Primary data: Secondary data : Positivist: Interpretivist : Feminist: Realist: Validity: Reliability: 11 Representativeness: Target population: Sampling frame: Random sample: Stratified random sample: Systematic sampling: Quota sampling: Snowball sampling: Purposive sampling: Gatekeepers : Generalisability: Hawthorne effect: 12 Objective/ subjective: Operationalisation : Ethical issues: Practical issues: Social Survey: Questionnaire: Structured Interviews: Semi or unstructured interviews: Non-participant observation (Overt): Participant Observation (Covert): 13 Structured Observation: Statistical data: Content Analysis: Focus Groups: Personal Documents: Longitudinal studies: Pilot Studies: Experiments: Case Studies: Triangulation and mixed methods: 14 15
