Week 9 & 10 Log - B00444855(v1)
advertisement
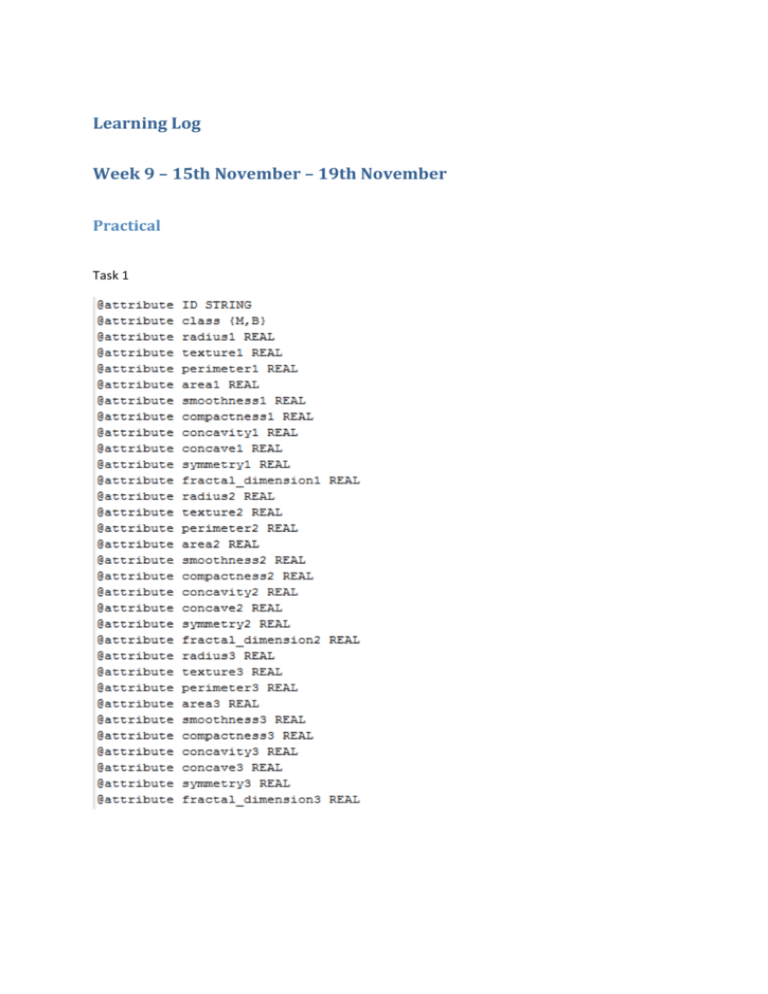
Learning Log Week 9 – 15th November – 19th November Practical Task 1 Task 2 Task 3.1 Supervised learning is where the machine concludes a function from supervised training data. The training data will consist of training examples. Each example will be a pair consisting of input objesct and output values. The supervised algorithm will analysis the training data and will produce an inferred function or classifier. Task 3.2 === Run information === Scheme: weka.classifiers.trees.J48 -C 0.25 -M 2 Relation: WDBC-weka.filters.unsupervised.attribute.ReorderR2,3,4,5,6,7,8,9,10,11,12,13,14,15,16,17,18,19,20,21,22,23,24,25,26,27,28,29,30,31,1weka.filters.supervised.attribute.AddClassification-Wweka.classifiers.rules.ZeroRweka.filters.supervised.attribute.AddClassification-Wweka.classifiers.rules.ZeroRweka.filters.supervised.attribute.AddClassification-Wweka.classifiers.rules.ZeroRweka.filters.supervised.attribute.AddClassification-Wweka.classifiers.rules.ZeroRweka.filters.AllFilter Instances: 569 Attributes: 31 radius1 texture1 perimeter1 area1 smoothness1 compactness1 concavity1 concave1 symmetry1 fractal_dimension1 radius2 texture2 perimeter2 area2 smoothness2 compactness2 concavity2 concave2 symmetry2 fractal_dimension2 radius3 texture3 perimeter3 area3 smoothness3 compactness3 concavity3 concave3 symmetry3 fractal_dimension3 class Test mode: 10-fold cross-validation === Classifier model (full training set) === J48 pruned tree ------------------ area3 <= 880.8 | concave3 <= 0.1357 | | area2 <= 36.46: B (319.0/3.0) | | area2 > 36.46 | | | radius1 <= 14.97 | | | | texture2 <= 1.978: B (11.0) | | | | texture2 > 1.978 | | | | | texture2 <= 2.239: M (2.0) | | | | | texture2 > 2.239: B (3.0) | | | radius1 > 14.97: M (2.0) | concave3 > 0.1357 | | texture3 <= 27.37 | | | concave3 <= 0.1789 | | | | area2 <= 21.91: B (12.0) | | | | area2 > 21.91 | | | | | perimeter2 <= 2.615: M (6.0/1.0) | | | | | perimeter2 > 2.615: B (6.0) | | | concave3 > 0.1789: M (4.0) | | texture3 > 27.37: M (21.0) area3 > 880.8 | concavity1 <= 0.0716 | | texture1 <= 19.54: B (9.0/1.0) | | texture1 > 19.54: M (10.0) | concavity1 > 0.0716: M (164.0) Number of Leaves : 13 Size of the tree : 25 Time taken to build model: 0.06 seconds === Stratified cross-validation === === Summary === Correctly Classified Instances 530 93.1459 % 39 6.8541 % Incorrectly Classified Instances Kappa statistic 0.8544 Mean absolute error 0.0741 Root mean squared error 0.2579 Relative absolute error 15.8366 % Root relative squared error 53.331 % Total Number of Instances 569 === Detailed Accuracy By Class === TP Rate FP Rate Precision Recall F-Measure ROC Area Class 0.925 0.064 0.895 0.925 0.91 0.927 M 0.936 0.075 0.954 0.936 0.945 0.927 B Weighted Avg. 0.931 0.071 === Confusion Matrix === a b <-- classified as 196 16 | a = M 23 334 | b = B 0.932 0.931 0.932 0.927 Task 3.3 Sensitivity – 0.931 Specificity – 0.071 Task 3.4 Random Forest Classification – Correct Classification – 95.7821% Incorrect Classification – 4.2179% Tp – 0.958 Kappa – 0.91 Decision Table Classification Correct Classification – 94.0246% Incorrect Classification – 5.9754% Tp – 0.94 Kappa – 0.871 JRIP Classification – Correct Classification – 92.7944% Incorrect Classification – 7.2056% Tp – 0.928 Kappa – 0.846 Task 3.5 In terms of correct classification random tree classification is the best with 95.7821% In terms of TP random forest classification had the highest of 0.958 In terms of kappa random forest had the highest with 0.91. From the tree classifications above the method in which provided the best results was Radom Forest Classification. Task 3.6 Results from increasing the FOLD 10 fold 20 fold 30 fold 40 fold 50 fold Correct Classification 95.7821% 93.3216% 94.9033% 94.0246% 95.2548% Incorrect Classification 4.2179% 6.6784% 5.0967% 5.9754% 4.7452% TP Kappa 0.958 0.933 0.949 0.94 0.953 0.91 0.8577 0.8905 0.8719 0.8982 From the changing the fold from 10 up to 40 the results where worse, 10 fold provided the best classification. When I entered 50 fold the results appeared to start improving, to see if the higher the fold was the better the result is I decided to enter a fold of 100, below are the results 100 fold Correct Classification 95.4306% Incorrect Classification 4.5694% As you can see the results slightly improved. TP Kappa 0.954 0.9011 Learning Log Week 10 – 22nd November – 26th November Practical Task 2.1 Unsupervised learning is a class of problems where you seek to determine how the data is organised. There are many methods employed here which are based on data mining methods used to preprocess data. It is different from supervised learning as the learner is only given unlabelled examples. Task 2.3 I expect to see two clusters from the dataset Task 2.5 Sensitivity = 0.08421 Specificity = 0.04761 Task 2.6 EM -1 Using EM-1 did not cluster the data correctly. EM -2 Sensitivity = 0.5507 Specificity = 0.1383 Tasks 3.1 Data cleansing is where the detection and correction or removal of corrupt or inaccurate records from the record set takes place. Task 3.2 Data cleansing algorithms can be found under the pre-process tab, and selecting filter.

