Variable List and Hypo Sheet
advertisement

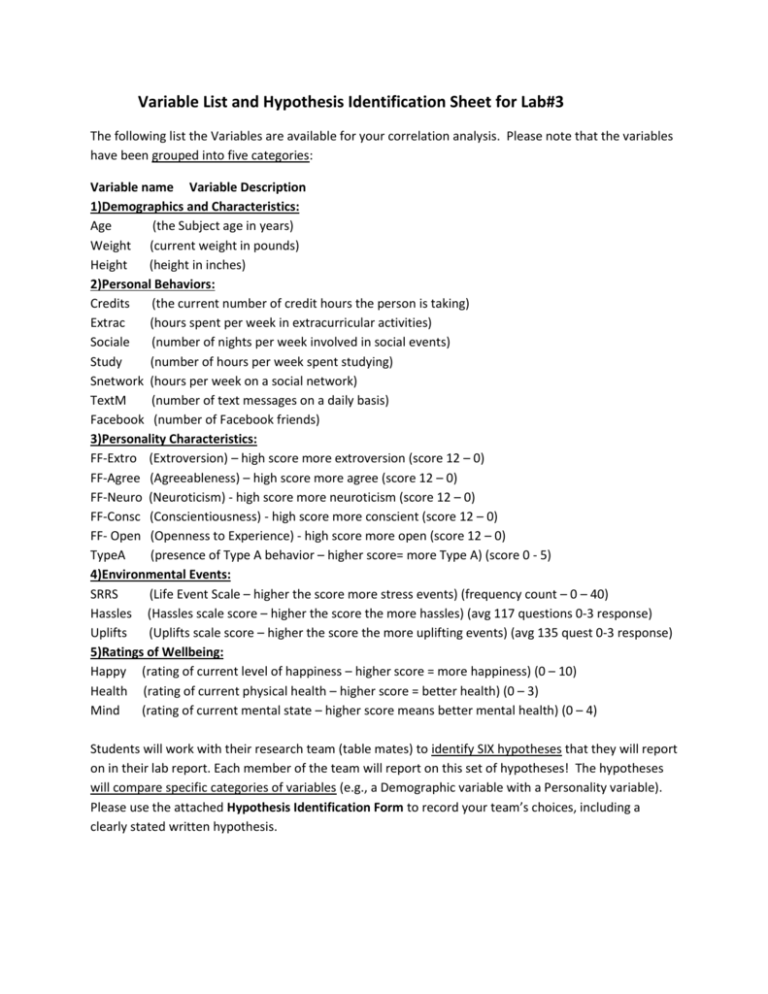
Variable List and Hypothesis Identification Sheet for Lab#3 The following list the Variables are available for your correlation analysis. Please note that the variables have been grouped into five categories: Variable name Variable Description 1)Demographics and Characteristics: Age (the Subject age in years) Weight (current weight in pounds) Height (height in inches) 2)Personal Behaviors: Credits (the current number of credit hours the person is taking) Extrac (hours spent per week in extracurricular activities) Sociale (number of nights per week involved in social events) Study (number of hours per week spent studying) Snetwork (hours per week on a social network) TextM (number of text messages on a daily basis) Facebook (number of Facebook friends) 3)Personality Characteristics: FF-Extro (Extroversion) – high score more extroversion (score 12 – 0) FF-Agree (Agreeableness) – high score more agree (score 12 – 0) FF-Neuro (Neuroticism) - high score more neuroticism (score 12 – 0) FF-Consc (Conscientiousness) - high score more conscient (score 12 – 0) FF- Open (Openness to Experience) - high score more open (score 12 – 0) TypeA (presence of Type A behavior – higher score= more Type A) (score 0 - 5) 4)Environmental Events: SRRS (Life Event Scale – higher the score more stress events) (frequency count – 0 – 40) Hassles (Hassles scale score – higher the score the more hassles) (avg 117 questions 0-3 response) Uplifts (Uplifts scale score – higher the score the more uplifting events) (avg 135 quest 0-3 response) 5)Ratings of Wellbeing: Happy (rating of current level of happiness – higher score = more happiness) (0 – 10) Health (rating of current physical health – higher score = better health) (0 – 3) Mind (rating of current mental state – higher score means better mental health) (0 – 4) Students will work with their research team (table mates) to identify SIX hypotheses that they will report on in their lab report. Each member of the team will report on this set of hypotheses! The hypotheses will compare specific categories of variables (e.g., a Demographic variable with a Personality variable). Please use the attached Hypothesis Identification Form to record your team’s choices, including a clearly stated written hypothesis. The Five Factor Model (from: http://en.wikipedia.org/wiki/Big_Five_personality_traits The Big Five factors and their constituent traits can be summarized as: Openness – (inventive/curious vs. consistent/cautious). Appreciation for art, emotion, adventure, unusual ideas, curiosity, and variety of experience. Conscientiousness – (efficient/organized vs. easy-going/careless). A tendency to show self-discipline, act dutifully, and aim for achievement; planned rather than spontaneous behavior. Extraversion – (outgoing/energetic vs. solitary/reserved). Energy, positive emotions, urgency, and the tendency to seek stimulation in the company of others. Agreeableness – (friendly/compassionate vs. cold/unkind). A tendency to be compassionate and cooperative rather than suspicious and antagonistic towards others. Neuroticism – (sensitive/nervous vs. secure/confident). A tendency to experience unpleasant emotions easily, such as anger, anxiety, depression, or vulnerability. The Big Five model is a comprehensive, empirical, data-driven research finding. Identifying the traits and structure of human personality has been one of the most fundamental goals in all of psychology. The five broad factors were discovered and defined by several independent sets of researchers (Digman, 1990). These researchers began by studying known personality traits and then factor-analyzing hundreds of measures of these traits (in self-report and questionnaire data, peer ratings, and objective measures from experimental settings) in order to find the underlying factors of personality. The Big Five traits are also referred to as the "Five Factor Model" or FFM (Costa & McCrae, 1992), and as the Global Factors of personality (Russell & Karol, 1994). Type A Personality (from: http://en.wikipedia.org/wiki/Type_A_and_Type_B_personality_theory) Originally published in the 1950s, the Type A and Type B personality theory is a theory which describes two common, contrasting personality types—the high-strung Type A and the easy-going Type B—as patterns of behavior that could either raise or lower, respectively, one's chances of developing coronary heart disease (CHD). The theory describes a Type A individual as ambitious, aggressive, business-like, controlling, highly competitive, impatient, preoccupied with his or her status, time-conscious, and tightly-wound. People with Type A personalities are often high-achieving "workaholics" who multi-task, push themselves with deadlines, and hate both delays and ambivalence. In his 1996 book, Type A Behavior: Its Diagnosis and Treatment, Friedman suggests that Type A behavior is expressed in three major symptoms: free-floating hostility, which can be triggered by even minor incidents; time urgency and impatience, which causes irritation and exasperation; and a competitive drive, which causes stress and an achievement-driven mentality. The first of these symptoms is believed to be covert and therefore less observable, while the other two are more overt, recent research has pointed to a strong connection between this anger and CHD. The theory describes Type B individuals as perfect contrast to those with Type A personalities. People with Type B personalities are generally patient, relaxed, easy-going, and at times lacking an overriding sense of urgency. Because of these characteristics, Type B individuals are often described as apathetic and disengaged by individuals with Type A or other personality types. However, Type B individuals are not necessarily less successful than Type A individuals! Hypothesis Identification Form Please write out your team’s hypothesis for each pairing using the specific variable name. The pairing numbers are based on the category’s number (i.e., #1 = Demographics & #2 = Personal behaviors) Hypothesis #1 (#1 with #2) Hypothesis #2 (#2 with #3) Hypothesis #3 (#3 with #4) Hypothesis #4 (#4 with #5) Hypothesis #5 (#2 with #4) Hypothesis #6 (#2 with #5) Hypothesis #7 (Gender with any of the above #combinations) – In this case you are hypothesizing a difference between the genders on a hypothesized correlational relationship


