Ch. 8 Additional Review Presidential Approval Ratings According to
advertisement

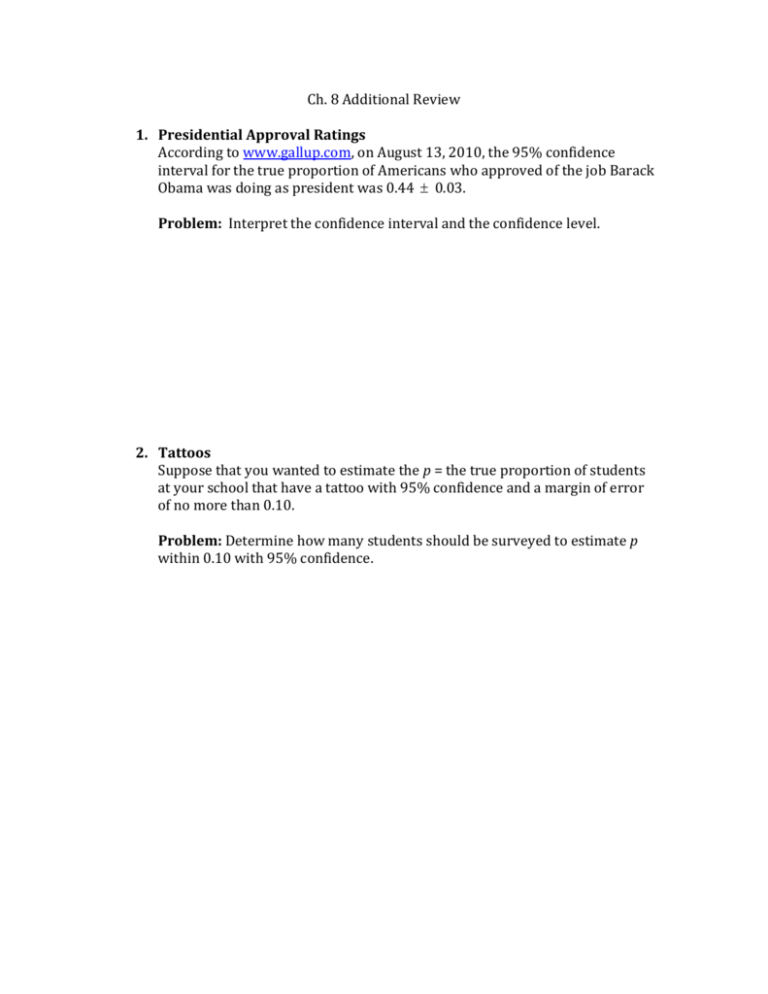
Ch. 8 Additional Review 1. Presidential Approval Ratings According to www.gallup.com, on August 13, 2010, the 95% confidence interval for the true proportion of Americans who approved of the job Barack Obama was doing as president was 0.44 0.03. Problem: Interpret the confidence interval and the confidence level. 2. Tattoos Suppose that you wanted to estimate the p = the true proportion of students at your school that have a tattoo with 95% confidence and a margin of error of no more than 0.10. Problem: Determine how many students should be surveyed to estimate p within 0.10 with 95% confidence. 3. The Pennies Problem: Ms. Smith’s class took an SRS of 102 pennies and discovered that 57 of the pennies were more than 10 years old. (a) Calculate and interpret a 99% confidence interval for p = the true proportion of pennies from the collection that are more than 10 years old. (b) Is it plausible that exactly 60% of all the pennies in the collection are more than 10 years old? Explain. 4. Soda Bottles The volume of bottles of soda from an assembly ine is known to have a standard deviation of 0.076 liters. A quality control inspector tested the volume of 36 randomly selected bottles of soda from the assembly line and obtained a mean volume of 1.98 liters. Problem: Find the 98% confidence interval for the mean volume of all bottles from the assembly line. 5. You are sampling from a population with a known standard deviation of 20 and want to construct a 95% confidence interval about the mean with a margin or error of no more than 4. What is the smallest sample that will produce such an interval? 6. Find the critical t* value for each of the following confidence intervals: (a) 95% confidence interval with 10 degrees of freedom. (b) 70% confidence interval when n = 24 7. Considerable research is being done in bioremediation—the use of living organisms to clean-up pollution. In a recently conducted experiment, researchers used fungi to degrade hydrocarbons, the by-products of incomplete combustion of fossil fuels. These by-products can cause cancer, and their accumulation in water and soil poses an environmental hazard. In order to be cost-effective, a minimum of 1.00 micromoles/minute/gram of soil of a particular hydrocarbon must be degraded. The researchers added fungi and growth media (essentially sugar) to the soil in 9 containers with random samples of soil and obtained the following degradation rates in micromoles/min/gram: (a) Calculate and interpret the standard error of the mean for these data. (b) Construct and interpret a 90% confidence interval for the mean degradation rate. Use the four-step process. (c) Can the researchers be confident that this process will be cost-effective? Solutions: 1. Interval: We are 95% confident that the interval from 0.41 to 0.47 captures the true proportion of Americans who approve of the job Barack Obama was doing as president at the time of the poll. Level: In 95% of all possible samples of the same size, the resulting confidence interval would capture the true proportion of Americans who approve of the job Barack Obama was doing as president. 2. Since we don’t have any previous knowledge of the proportion of students with a tattoo, we will use p̂ = 0.5 to estimate the sample size needed. 0.5 1 0.5 1.96 0.10 0.5 1 0.5 n n 96.04 n 0.10 So, we need to survey at least 97 students to estimate the true proportion of students with a tattoo with 95% confidence and a margin of error of at most 0.10. 2 1.96 3. Step 1: We are interested in the true proportion, P, of pennies more than 10 years old. Step 2: One – Sample Z-Interval a. Random: A SRS was taken. b. Normal: p̂ = 57/102 = 0.559 i. .559 (102) = 57.02 ii. .441 (102) = 44.98 Both are greater than 10, so the sampling distribution is approximately normal. c. Independent: It is reasonable to assume that there are at least 1,020 pennies. Step 3: The critical value for a 99% confidence interval can be found by looking for the point that has an area of 0.005 to the left. The calculator’s invNorm(0.005,0,1) gives –2.576 so the appropriate critical value for 99% confidence is z* = 2.576. The 99% confidence interval is: pˆ 1 pˆ 0.559 1 0.559 pˆ z * = 0.559 2.576 = 0.559 0.127 = (0.432, 0.686) n 102 We are 99% confident that the interval from 0.432 to 0.686 captures the actual proportion of pennies in the collection that are more than 10 years old. (b) Yes, since 0.6 is included in the confidence interval, it is plausible that 60% of all the pennies in the collection are more than 10 years old. 4. Solution a. Step 1: We are interested in estimating the mean volume of all bottles, 𝜇, from the assembly line. b. Step 2: One – Sample Z-Interval i. Random: A SRS was taken. ii. Normal: The sample size is large, the CLT tells us the sampling distribution will be approximately normal (n=36 > 30). iii. Independent: It is reasonable to assume that the company produces more than 360 bottles of soda on their assembly line. c. Step 3: The 98% Confidence Interval – x ± z * s / n = 1.98± 2.33*.076 / 36 = 1.98 0.0295 = (1.9505, 2.0095) d. Step 4: We are 98% confident that the interval from 1.95 to 2.00 liters captures the true mean volume of all bottles from the assembly line. æ 1.96 * 20 ö 5. 1.96*20 / n £ 4 ç ÷ £ n n 96.04 4 è ø So, we need to sample at least 97 individuals in the population to estimate the true mean with 95% confidence and a margin of error of at most 4. 2 6. a) invT(.975, 10) = 2.228 b) invT(.85, 23) = 1.06 𝑠 7. (a) Standard error = 𝑥 = 0.053. If many samples of this size were taken, the √9 difference between a sample mean degradation rate and the population mean degradation rate would be, on average, about 0.053. (b) a. Step 1: We wish to estimate, with 90% confidence, the true mean degradation rate of hydrocarbons. b. Step 2: One – Sample t-Interval i. Random: We will have to assume a random sample of soil was taken. ii. Normal: Since n = 9, we should examine the data, since the normality of the population is important. The dotplot is reasonably symmetric and shows no evidence of strong skew or outliers. We should be safe using t-procedures. iii. Independent: It seems reasonable to assume that individual samples of soil are independently selected, and that we are sampling less than 10% of the contaminated soil. c. Step 3: The 90% Confidence Interval – x ± t * Sx / n = 1.076 ±1.86*.158 / 9 = 1.076 0.098 = (.978, 1.174) d. Step 4: We are 90% confident that the interval 0.978 to 1.174 contains the true mean degradation rate by these fungi. (c) Since some of this interval is below 1.00, we cannot be confident that the degradation rate is greater than 1.00, so the methods may not be costeffective.


