Cerretani - Assignment 5
advertisement

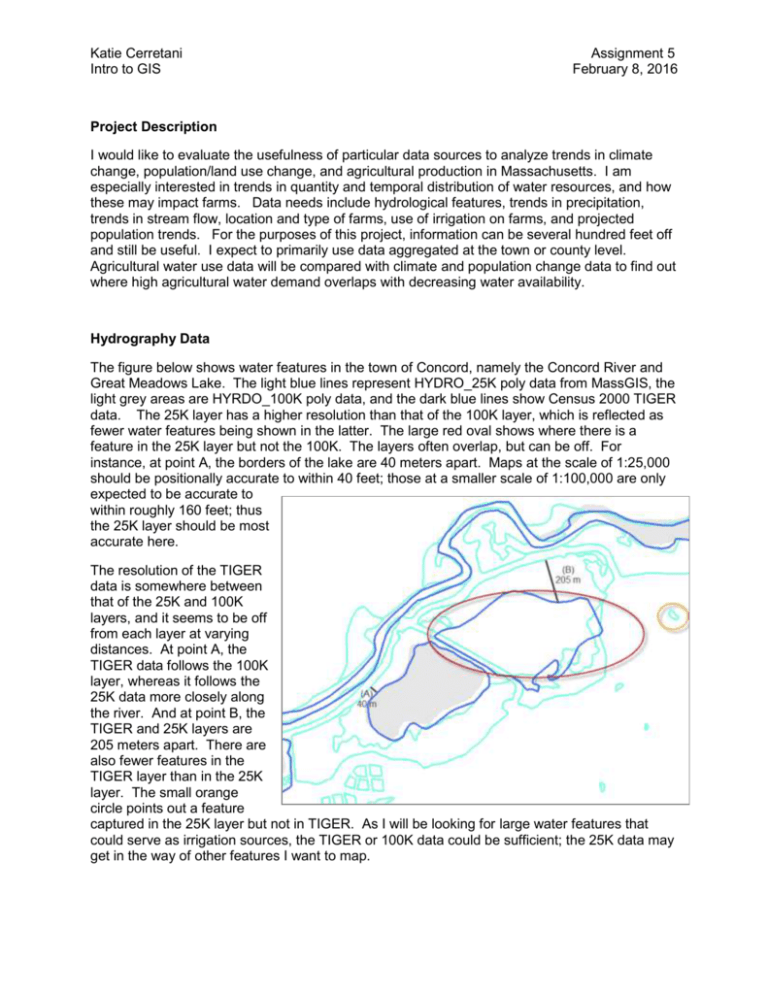
Katie Cerretani Intro to GIS Assignment 5 February 8, 2016 Project Description I would like to evaluate the usefulness of particular data sources to analyze trends in climate change, population/land use change, and agricultural production in Massachusetts. I am especially interested in trends in quantity and temporal distribution of water resources, and how these may impact farms. Data needs include hydrological features, trends in precipitation, trends in stream flow, location and type of farms, use of irrigation on farms, and projected population trends. For the purposes of this project, information can be several hundred feet off and still be useful. I expect to primarily use data aggregated at the town or county level. Agricultural water use data will be compared with climate and population change data to find out where high agricultural water demand overlaps with decreasing water availability. Hydrography Data The figure below shows water features in the town of Concord, namely the Concord River and Great Meadows Lake. The light blue lines represent HYDRO_25K poly data from MassGIS, the light grey areas are HYRDO_100K poly data, and the dark blue lines show Census 2000 TIGER data. The 25K layer has a higher resolution than that of the 100K layer, which is reflected as fewer water features being shown in the latter. The large red oval shows where there is a feature in the 25K layer but not the 100K. The layers often overlap, but can be off. For instance, at point A, the borders of the lake are 40 meters apart. Maps at the scale of 1:25,000 should be positionally accurate to within 40 feet; those at a smaller scale of 1:100,000 are only expected to be accurate to within roughly 160 feet; thus the 25K layer should be most accurate here. The resolution of the TIGER data is somewhere between that of the 25K and 100K layers, and it seems to be off from each layer at varying distances. At point A, the TIGER data follows the 100K layer, whereas it follows the 25K data more closely along the river. And at point B, the TIGER and 25K layers are 205 meters apart. There are also fewer features in the TIGER layer than in the 25K layer. The small orange circle points out a feature captured in the 25K layer but not in TIGER. As I will be looking for large water features that could serve as irrigation sources, the TIGER or 100K data could be sufficient; the 25K data may get in the way of other features I want to map. Katie Cerretani Intro to GIS Assignment 5 February 8, 2016 Land Use and Land Cover I am interested in showing the locations of different land use and land cover classifications, including agricultural land (crop production), water sources, and residential areas. Figures (a) and (b) below use land use (from MassGIS) and land cover (from USGS) data, respectively to illustrate these classifications. I have colored the agricultural land brown, residential/developed areas yellow, and water sources blue. The differences among yellow areas in each map appear to be due to the slight mismatch between residential land in (a) and developed land in (b). Otherwise, the maps match up pretty well. Land use data is at the 1:25,000 scale so may be assumed to be accurate ±40 feet. According to the USGS web site, the Land Cover data was estimated from aerial photographs. Since they did not use orthophotos, there could be a considerable amount of distortion. For my purposes, it will be useful to simply have an idea of how these land uses are distributed spatial within counties and towns in Massachusetts. (a) (b) One limitation of the land cover data for my purposes is that I cannot distinguish among as many types of agriculture as I can when using land use data. When I break the land use data down into more categories, I can see that most of the agricultural land is actually made up of cranberry bogs (in red at left). The map in the bottom right corner here shows how the 25 hydro data can also be used to identify cranberry bogs (purple) and surface water sources (blue). Upon examining the 2008 USGS orthophotos available on MassGIS, it appears that one such water source serves several cranberry bogs (see below, left). The orthophotos have a resolution of 1 foot and have an accuracy of ±3 meters (about 9 feet). The orthophoto and land use maps are a bit off; at one point Katie Cerretani Intro to GIS Assignment 5 February 8, 2016 the boundary of the water feature differs by about 40 meters. This is fine for my purposes as I only wish to show general locations and the relative proximity of such features as farms, water sources, and residential areas. The area in the white rectangle shows land classified as cranberry bog which appears to be barren. Upon closer inspection and comparison with Google earth (below right), it appears that this area is a mix of bog and access roads. The area in the red circle, classified in the land use data as pasture, looks instead to be low-density residential land here. One reason could be that the orthophotos I’m using were collected in 2008 and the land use data is from 1999. It will be useful to check some of my land use data against orthophotos to make sure there aren’t a large number of these mistakes. Water Withdrawal Permits for Farms I have obtained information on locations of farms that have permits or registrations to withdraw water under the Water Management Act (WMA). The available data includes the following fields: Industry Type (including cranberry and misc agriculture separated out) Registration or Permit ID Katie Cerretani Intro to GIS Assignment 5 February 8, 2016 Type (registration or permit) – permits are issued to new users, while registrations were issued to existing users at the time the WMA was implemented Registration or Permit Number End Date (for expired registrations or permits) Facility (farm) Name Facility Town Volume allowed under registration (millions of gallons per day) Number of days under registration Volume allowed under permit Number of days under permit Start and end date for some new permits Actual water withdrawals by facility for years 1997-2007 For the purposes of comparing water withdrawal permit locations to stressed water basins, resolution to the town level is sufficient. However, I also hope to look at existing infrastructure for irrigation on Massachusetts farms, including water impoundments. Absent specific data on this, I could estimate the extent of this practice by selecting water impoundment data from the 25K hydro data layer and comparing that with farm locations. If the farms storing water are also those with WMA permits, it then becomes necessary to have more accurate spatial data on the permitted farm locations. This is illustrated by the figure below, where the data point for the WMA permit is located in the center of the town polygon, the farm name associated with that permit is positioned near the town name, and there are two hydro features classified as water impoundments. Without geocoding, there is no way of knowing where the actual farm is located within the town, and where it is in relation to the water impoundments. A simple geocoding exercise using ReferenceUSA (c) reveals that Verrill Farm is in fact located in the southern part of Concord. Zooming in and comparing with orthophotos (d) (MassGIS 2008), the geocode appears to be on target. Tiger road centerlines are off by about 10 to 30 meters, but this is inconsequential for my analysis. In order to take one more verification step, I compared the MassGIS orthophotos with Google Maps imagery (e), and the two match quite nicely. Katie Cerretani Intro to GIS Assignment 5 February 8, 2016 (c) (d) (e) Stressed River Basins Another layer I would like to use is one for river basins in Massachusetts classified as experiencing “high” stress. I received this from the Natural Resources Conservation Service’s Massachusetts office. There is no metadata available, but a report from 2001 indicates what stream gages were used to determine stress levels. The available attributes are: Station (number), Station Name, and Final Stress Level. Station numbers correspond to the USGS Stream gaging stations, which come with latitude and longitude information. I would like to see whether or not there is overlap between the high stress basins and the WMA permitted farms. Below is a map (f) combing stressed basins and the permits. Since towns are not always entirely encompassed by individual river basins, it becomes important here to have more specific data on the farm locations. I’ve circled in red a location that appears to have some overlap. However, when I zoon in (g) there is none. I would need to geocode the permit locations to know for sure whether or not there is overlap here. Katie Cerretani Intro to GIS (f) (g) Assignment 5 February 8, 2016 Katie Cerretani Intro to GIS Assignment 5 February 8, 2016 Irrigation Data The National Agricultural Statistics Service (NASS) does a census of agriculture every five years, which includes data on irrigation, disaggregated at the county level. I would like to use this information to display the spatial distribution of agricultural water use in Massachusetts. The map below is a first attempt. It shows the percentage of farms that use irrigation, by county. While this gives a good impression of where irrigation is concentrated among counties, it is not very helpful at matching water use to stressed river basins. It also tells us nothing about the quantity of water consumed. Actual withdrawal data from the Water Management Act permits data set will be useful in quantifying agricultural water use by larger irrigators. NASS also has a report with detailed irrigation information, including estimated water applied per acre. This might capture many of the smaller operations, but is only available at the state level.


