Learning goals: Students will be able to
advertisement

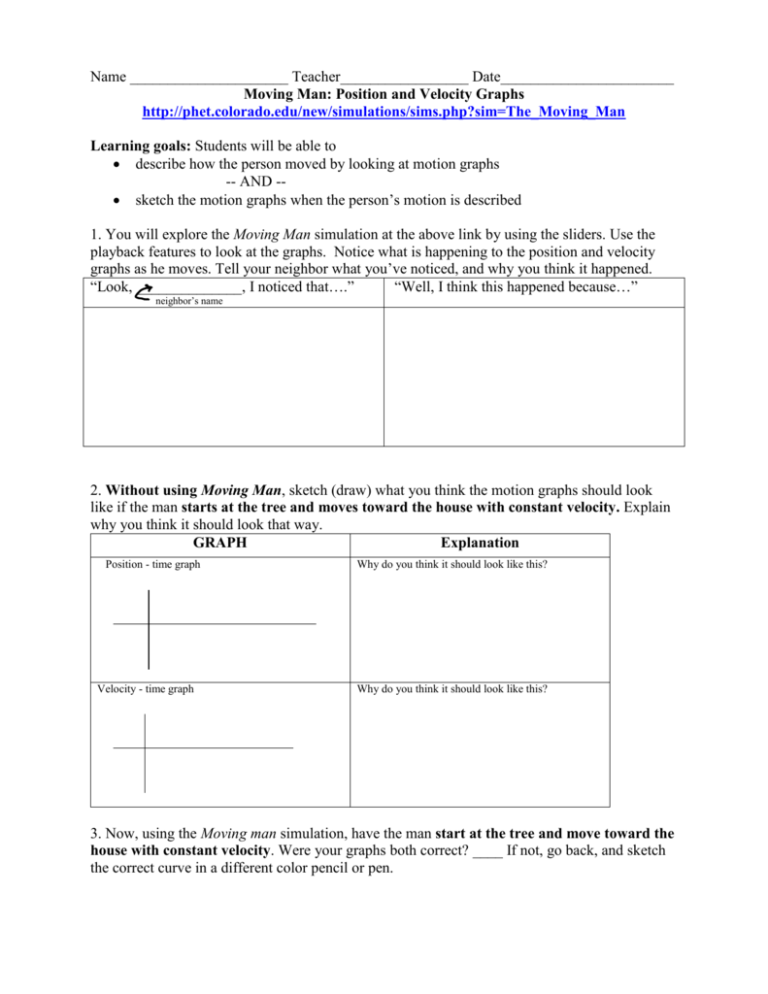
Name _____________________ Teacher_________________ Date_______________________ Moving Man: Position and Velocity Graphs http://phet.colorado.edu/new/simulations/sims.php?sim=The_Moving_Man Learning goals: Students will be able to describe how the person moved by looking at motion graphs -- AND - sketch the motion graphs when the person’s motion is described 1. You will explore the Moving Man simulation at the above link by using the sliders. Use the playback features to look at the graphs. Notice what is happening to the position and velocity graphs as he moves. Tell your neighbor what you’ve noticed, and why you think it happened. “Look, ______________, I noticed that….” “Well, I think this happened because…” neighbor’s name 2. Without using Moving Man, sketch (draw) what you think the motion graphs should look like if the man starts at the tree and moves toward the house with constant velocity. Explain why you think it should look that way. GRAPH Explanation Position - time graph Velocity - time graph Why do you think it should look like this? Why do you think it should look like this? 3. Now, using the Moving man simulation, have the man start at the tree and move toward the house with constant velocity. Were your graphs both correct? ____ If not, go back, and sketch the correct curve in a different color pencil or pen. 4. Without using Moving Man, sketch what you think the motion graphs should look like if the man leans against the wall by his house, without moving. Explain why you think it should look that way. GRAPH Explanation Position - time graph Velocity - time graph Why do you think it should look like this? Why do you think it should look like this? 5. Now, using the Moving man simulation, have the man lean against the wall by his house, without moving. Were your graphs both correct? ____ If not, go back, and sketch the correct curve in a different color pencil or pen. 6. Without using Moving Man, sketch what you think the motion graphs should look like if he moved as described: The man stands still while he talks on his cell phone at the middle of the sidewalk, then walks toward the house at a constant rate trying to get better cell reception. He comes to a sudden stop when the coverage is good (about a meter before the house) and stands still to finish his conversation. GRAPH Explanation Position - time graph Velocity - time graph Why do you think it should look like this? Why do you think it should look like this? 7. Now, using the Moving man simulation, have the man move in the way described. Were your graphs both correct? ____ If not, go back, and sketch the correct curve in a different color pencil or pen. 8. Look at your graphs, explanations and the corrections from questions 2 -7. Describe why some of your predictions were wrong and how your ideas about motion have changed. 9. Without using Moving Man, sketch the position, and velocity graphs for the following story: A man is napping under the tree. He wakes up and walks toward the house at a constant velocity. He stops because he is worried that he dropped his keys. He stands still as he searches his pockets for his keys. When he discovers he can’t find them, he runs towards the tree at a constant velocity. He hits the tree and gets knocked out, so he can’t move. Position-time Velocity-time 10. Now use Moving Man. Were your graphs both correct? ____ If not, go back, and draw the correct curve in a different color pencil or pen. 11. With your lab partners, write a description of motion (a story) that you could test. Test it, and then explain how you used the program to make the graphs. Sketch the graphs. Position-time Velocity-time 12. Individually write a possible story for the following graph. Then compare your story with your lab partners to check if it’s reasonable. time


