bit25457-sup-0001-SuppData
advertisement

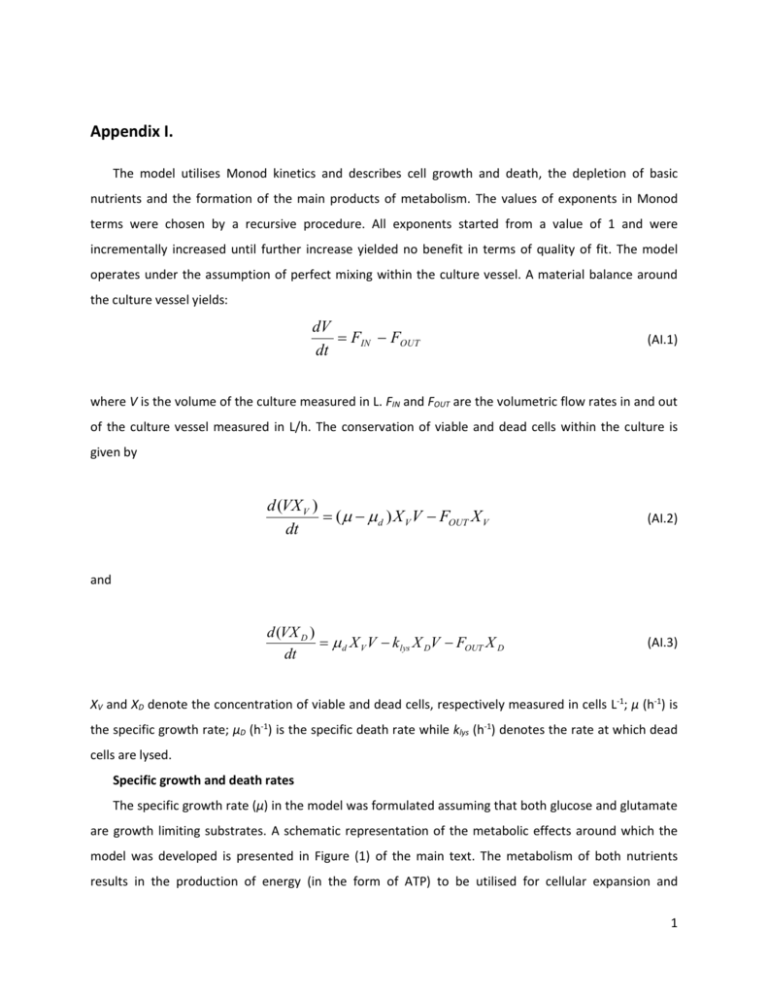
Appendix I. The model utilises Monod kinetics and describes cell growth and death, the depletion of basic nutrients and the formation of the main products of metabolism. The values of exponents in Monod terms were chosen by a recursive procedure. All exponents started from a value of 1 and were incrementally increased until further increase yielded no benefit in terms of quality of fit. The model operates under the assumption of perfect mixing within the culture vessel. A material balance around the culture vessel yields: dV FIN FOUT dt (AI.1) where V is the volume of the culture measured in L. FIN and FOUT are the volumetric flow rates in and out of the culture vessel measured in L/h. The conservation of viable and dead cells within the culture is given by d (VX V ) ( d ) X V V FOUT X V dt (AI.2) d (VX D ) d X V V k lys X DV FOUT X D dt (AI.3) and XV and XD denote the concentration of viable and dead cells, respectively measured in cells L-1; μ (h-1) is the specific growth rate; μD (h-1) is the specific death rate while klys (h-1) denotes the rate at which dead cells are lysed. Specific growth and death rates The specific growth rate (μ) in the model was formulated assuming that both glucose and glutamate are growth limiting substrates. A schematic representation of the metabolic effects around which the model was developed is presented in Figure (1) of the main text. The metabolism of both nutrients results in the production of energy (in the form of ATP) to be utilised for cellular expansion and 1 biosynthesis. As glutamate and glucose are metabolised through different metabolic pathways, their combined effect was modelled as additive rather than multiplicative. Bacterial cells growing on multiple substrates have been shown to preferentially consume one of the substrates over the rest (Kompala, Ramkrishna, Tsao, 1984). In the case of mammalian cells, glucose at high concentrations has been shown to be preferentially consumed over glutamine (Newland, Greenfield, Reid, 1990). However, when studying a modified GS-NS0 cell line versus the parent, Veraitch & Al-Rubeai (2005) observed that a 45% decrease in glutamate uptake in the modified cell line resulted in a 133% increase in glucose uptake. Moreover, Paredes et al. (1999) noticed reduced glucose uptake in a GS modified cell line compared to the parent cell line. For GS equipped cells, given the fact that glutamine is essential for the proliferation of cells (Meister, 1974); growth on glutamate was assumed to have priority over growth on glucose. Therefore, the specific growth rate will be given by: GLC GLU (AI.4) where, GLU MAX ,GLU , GLC 1 QMET MAX ,GLC [GLU ]2 K G2 ,GLU [GLU ]2 [GLC ]2 1 2 2 K G ,GLC [GLC ] 1 K I , AMM [ AMM ] (AI.5) (AI.6) KG,GLU (mM) and KG,GLC (mM) are the saturation constants for growth on glucose and glutamate, respectively. [GLU], [GLC] and [AMM] (mM) are the concentrations in the extracellular medium of glutamate, glucose and ammonia, respectively. μMAX,GLU,Φ (h-1) is the apparent maximal specific growth rate for growth on glutamate utilising the equation for the prediction of the lag phase (Appendix II), while μMAX,GLC (h-1) is the maximal theoretical growth rate for growth on glucose. Apart from being toxic to the cells at concentrations above 4mM (Ozturk, Riley, Palsson, 1992) ammonia has been shown to inhibit growth at lower concentrations (Newland, Greenfield, Reid, 1990). KI,AMM (mM) is a constant for growth inhibition from ammonia. The term for ammonia inhibition appears only in equation (AI.6) since the experimental observations of Chapter 4 indicated that ammonia accumulates in the culture media after glutamate has been exhausted. The term QMET describes the preferential uptake of glutamate. Assuming that it follows saturation kinetics it will be given by 2 QMET [GLU ] K MET [GLU ] (AI.7) with KMET (mM) being the relevant saturation constant. The sole contributor to the death of cells was considered to be lactate formed via the metabolism of glucose. Thus, the equation describing the specific death rate remained the same as in Chapter 4. That is, d d ,MAX K 1 I , LAC LAC (AI.8) 2 where μd,MAX (h-1)is the maximum theoretical death rate and KI,LAC (mM) is the constant associated with the toxicity of lactate. Nutrients, metabolites and product formation The uptake of glucose was modelled as a function of the respective growth rate (μGLC). A material balance for the conservation of glucose around the culture vessel yields: d [GLC] V QGLC X V V FIN [GLC] IN FOUT [GLC] dt (AI.9) where, QGLC GLC YX ,GLC . (AI.10) [GLC]IN denotes the concentration of glucose in the inlet stream, YX,GLC (cells L-1 mM-1) is the yield for biomass from growth on glucose. Under the conditions studied in the present study (high glucose batch cultures), the basic product of glucose metabolism is lactate accounting for roughly 75% of consumed glucose (Acosta et al., 2007; Martinez et al., 2012). In the interest of maintaining the simplicity of unstructured models the alternate fates of glucose-derived carbon beyond conversion to lactate are not considered herein. A material balance for lactate yields: 3 d [ LAC ] V QLAC X V V FOUT [ LAC ] dt (AI.11) QLAC QGLC YLAC ,GLC . (AI.12) where, YLAC,GLC (mM LAC/mM GLC) is the yield of lactate production from the consumption of glucose. The uptake of glutamate was modelled as a function of the overall growth rate in contrast to the way glucose was modelled. The rationale behind this assumption is that regardless of the prominent active metabolic pathway there is always a requirement for glutamine; hence glutamate will always be consumed by the cells. Thus, a material balance for glutamate around the reactor vessel yields: d [GLU ] V QGLU X V V FIN [GLU ] IN FOUT [GLU ] dt (AI.13) with , if GLU 0 QGLU YX ,GLU 0 , otherwise . (AI.14) YX,GLU is the yield for biomass from the uptake of glutamate (cells L-1mM-1) and [GLU]IN (mM) is the concentration of glutamate in the inlet. Equation (AI.14) was formulated in a way that ensures that glutamate concentration cannot take negative values. Consumed glutamate is assumed to be converted intracellularly into glutamine through the action of Glutamine Synthetase. Thus, the dynamic evolution of glutamine concentration can be described by the following equation. d [GLN ] QGLU X V QGLN X V dt (AI.15) Since glutamine is produced inside the cells and does not appear in the extracellular media, culture volume is not accounted for in equation (AI.15). However cells, containing glutamine, are removed (via sampling) and diluted (via feeding). Therefore, the total amount of glutamine in the culture was considered in equation (AI.15) by multiplying glutamine production and consumption rates with the concentration of viable cells. Thus, the specific consumption rate of glutamine is given by 4 QGLN 1 QMET QMAX ,GLN [GLN ]2 K Q2 ,GLN [GLN ]2 (AI.16) where QMAX,GLN (mM cell-1h-1) is the maximal theoretical consumption rate of glutamine and KQ,GLN (mM) is the saturation constant for the consumption of glutamine. Accordingly, a material balance for ammonia yields: d [ AMM ] V ACTUAL QGLN YAMM ,GLN X V V FOUT [ AMM ] dt (AI.17) where YAMM,GLN (mM/mM) is the yield of ammonia from the consumption of glutamine. From the analysis of the experimental data for the three batch experiments, it was found that a correlation between seeding density and the yield of ammonia on glutamine (considering a 1-to-1 conversion of glutamate to glutamine) exists (Appendix II). A material balance around the culture vessel for secreted mAb yields: d [mAb] V GLU [GLC ] mmab X V V FOUT [mAb] dt Y x ,mab (AI.18) where [mAb] denotes monoclonal antibody concentration (mgL-1), Yx,mab denotes the yield of mAb production from the expansion of biomass and mmab (mg mM-1 cell-1 h-2) is the non-growth associated mAb accumulation term. The growth related portion of antibody formation has been correlated selectively with glutamate metabolism, since the metabolism of glutamate is ultimately linked with the biosynthetic pathways (Zhang et al., 2006). On the other hand, the maintenance term has been modelled to be inversely correlated to the overall growth rate and directly related to glucose concentration. Several studies on secreting hybridomas (Jang & Barford, 2000; Dinnis & James, 2005) suggest that under conditions of stress (such as starvation, or low growth rates) antibody productivity is increased indicating an inverse correlation between growth and productivity. The positive correlation of the maintenance term with glucose concentration was based on the assumption that the primary source 5 of cellular energy in cultures growing under the conditions considered herein would be glycolysis (Lazo, 1981; Xie & Wang, 1996b). References Acosta M.L., Sanchez A., Garcia F., Contreras A., Molina E. (2007). Analysis of kinetic, stoichiometry and regulation of glucose and glutamine metabolism in hybridoma batch cultures using logistic equations. Cytotechnology v54(3): 189 – 200. Dinnis D.M., James D.C. (2005). Engineering Mammalian Cell Factories for Improved Recombinant Monoclonal Antibody Production: Lessons From Nature?. Biotech. & Bioeng., v.91(2), pp: 18-189. Jang J.D., Barford J.P. (2000) An unstructured kinetic model of macromolecular metabolsim in batch and fed-batch cultures of hybridoma cells producing monoclonal antibodies. Biochem. Eng. Journal, v.4, pp: 153-168. Kompala D.S., Ramkrishna D. & Tsao G.T. (1984). Cybernetic modeling of microbial growth on multiple substrates. Biotech. & Bioeng, v.26, pp: 1272-1281. Lazo P. (1981). Amino Acids and Glucose Utilization by Different Metabolic Pathways in Ascites-Tumour Cells. Fur. J. Biochem., v.117, pp: 19-25. Martinez V.S., Dietmair S., Quek L.E., Hodson M.P., Gray P., Nielsen L.K. (2012). Flux balance analysis of CHO cells before and after a metabolic switch from lactate production to consumption. Biotech. & Bioeng. v110(2): 660 – 666. Meister A. (1974). 23. Glutamine Synthetase of Mammals. In: Paul D. Boyer, Editor(s), The Enzymes, Academic Press, v.10, pp: 699-754 Newland M., Greenfield P.F., Reid S. (1990). Hybridoma growth limitations: The roles of energy metabolism and ammonia production. Cytotechnology, v.3, pp: 215-229. Ozturk S.S., Riley M.R., Palsson B.O. (1992). Effects of Ammonia and Lactate on Hybridoma Growth, Metabolism, and Antibody-Production. Biotech. Bioeng., v.39, pp: 418-431. Veraitch F.S., Al-Rubeai M. (2005). Enhanced Growth in NS0 Cells Expressing Aminoglycoside Phosphotransferase is Associated with Changes in Metabolism, Productivity, and Apoptosis. Biotech. & Bioeng., v.92(5), pp: 589-599. Paredes C., Prats E., Cairó J.J., Azorín F., Cornudella L., Gòdia F. (1999). Modification of glucose and glutamine metabolism in hybridoma cells through metabolic engineering. Cytotechnology, v.30, pp: 85-93. Zhang F., Sun X., Yi X., Zhang Y. (2006). Metabolic characteristics of recombinant Chinese hamster ovary cells expressing glutamine synthetase in the presence and absence of glutamine. Cytothechnology, v.51, pp: 21-28. Xie L., Wang D.I.C. (1996b). Energy metabolism and ATP balance in animal cell cultivation using a stoichiometrically based reaction network. Biotech. & Bioeng., v.52(5), pp: 591-601. 6 Appendix II. The term (δ) is defined herein as “lag potential” and represents the potential of the culture for growth as determined by its initial viability. Initial viability is used herein in an attempt to represent the “quality” of the cells derived from the pre-culture and used for inoculation. X d ,0 (AII.1) X V ,0 where Xd,0 is the initial concentration of dead cells (cells L-1) and XV,0 is the initial concentration of viable cells (cells L-1). A heuristic correlation between viability of the cell inoculum and duration of the lag phase was observed for the 3 batch experiments conducted in this study. This correlation is captured through the lag potential term, which is used only when considering N independent experiments of varying initial conditions. One of the experiments is chosen as the “central” element (labelled C) and is used to normalise the lag potential of the remaining N-1 experiments as shown below: NORM C i i Î(1,..., N ) (AII.2) It should be noted that this is an empirical calculation and its validity under varying conditions has not been tested and/or proven. Although cell viability has been reported as a parameter that could affect the behaviour of a culture during lag-phase (Glacken et al., 1988; Chuck and Palsson, 1992), a direct correlation has not been yet made. References Glacken M.W., Adema E., Sinskey A.J. (1988). Mathematical descriptions of hybridoma culture kinetics: I. Initial metabolic rates. Biotech. & Bioeng. v32(4): 491 – 506. Chuck A.S. and Palsson B.O. (1992). Population balance between producing and nonproducing hybridoma clones is very sensitive to serum level, state of inoculum, and medium composition. Biotech. & Bioeng. v39(3): 354 – 360. 7 Appendix III. From the analysis of the experimental data for the three batch experiments, it was found that a correlation between seeding density and the yield of ammonia on glutamine (considering a 1-to-1 conversion of glutamate to glutamine) exists. Thus, plotting the seeding density (XV,0) versus the ratio of ammonia at the end of the experiment over initial glutamate concentration (AMMFINAL/GLU0) yields a ACTUAL straight line (Figure AIII.1) based on which the following equation for Y AMM was derived: ,GLN X V ,i , 0 X V ,C , 0 ACTUAL Y AMM Y 0 . 4 AMM ,GLN , GLN X V ,C , 0 (AIII.1) The value of YAMM,GLN was estimated from the experimental measurements of all three batch experiments. 0.4 is the slope of Figure (AIII.1), XV,i,0 is the concentration of the inoculum of any given experiment examined while XV,C,0 is the concentration of the inoculum of the “central” experiment X V ,i , 0 X V ,C , 0 versus X V ,C , 0 (batch experiment 1). It was based on a plot of the normalised seeding density the ratio of ammonia at the end of the experiment over initial glutamate concentration (AMMFINAL/GLU0) presented below. One of the experiments is chosen as the “central” element (labelled C) and is used to normalise all other experiments (labelled i). Batch Experiment 1 was chosen as the “central” element. 8 Figure AIII.1. Derivation of equation (AIII.1). 9 Appendix IV. All model and parameter estimation calculations were implemented in the advanced process modelling environment gPROMS® (Process Systems Enterprise, 2014). Parameter Estimation in gPROMS is based on the Maximum Likelihood formulation which provides simultaneous estimation of parameters in both the physical model of the process as well as the variance model of the measuring instruments. In particular the gPROMS parameter estimator determines values for the uncertain physical and variance model parameters, θ, that maximise the probability that the mathematical model predictions do match the experimental measurements. Assuming independent, normally distributed measurement errors, εijk, with zero means and standard deviations, σijk, this maximum likelihood goal can be captured through the following objective function: NE NVi NMij z ijk z ijk N 1 2 ln( 2 ) min ln ihk 2 2 2 ihk i 1 j 1 k 1 2 (AIV.1) where N stands for total number of measurements taken during all the experiments, θ is the set of model parameters to be estimated, NE is the number of experiments performed, NVi is the number of variables measured in the i th experiment and NMij is the number of measurements of the jth variable in the ith experiment. The variance of the kth measurement of variable j in experiment i is denoted as σ2ijk, while z ijk is the kth measured value of variable j in experiment i and z ijk is the kth (model-) predicted value of variable j in experiment i. The above formulation can be reduced to a recursive least squares parameter estimation if no variance models for the sensors are selected. For further information the reader is kindly directed to the software’s documentation. 10


