Copper assay protocol
advertisement
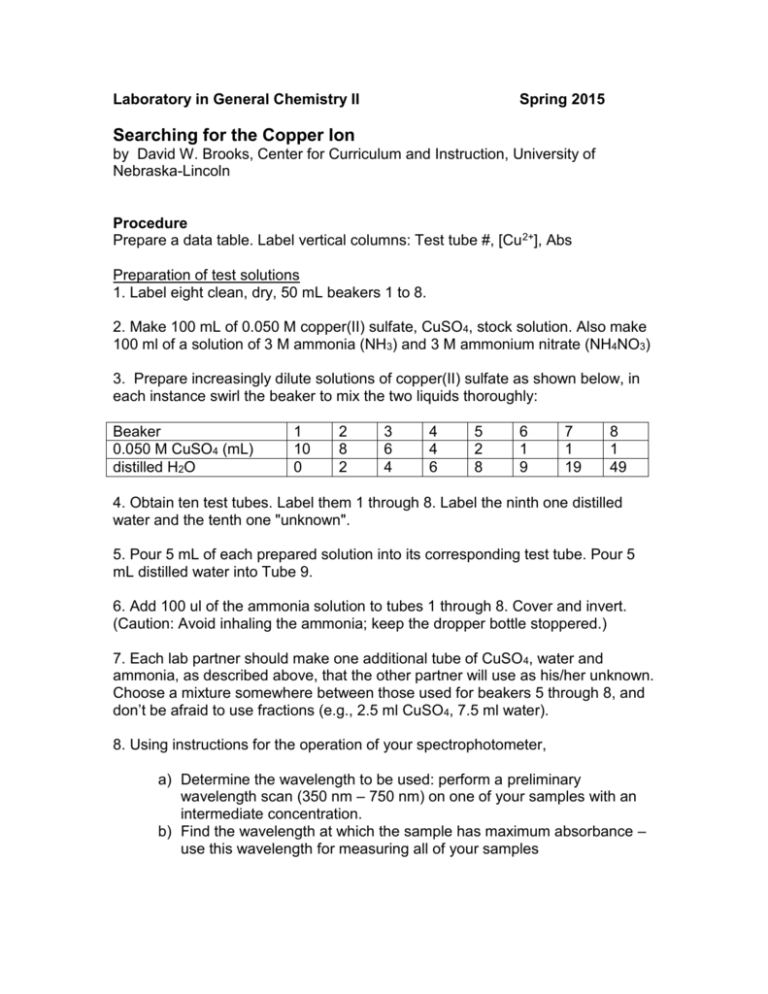
Laboratory in General Chemistry II Spring 2015 Searching for the Copper Ion by David W. Brooks, Center for Curriculum and Instruction, University of Nebraska-Lincoln Procedure Prepare a data table. Label vertical columns: Test tube #, [Cu 2+], Abs Preparation of test solutions 1. Label eight clean, dry, 50 mL beakers 1 to 8. 2. Make 100 mL of 0.050 M copper(II) sulfate, CuSO4, stock solution. Also make 100 ml of a solution of 3 M ammonia (NH3) and 3 M ammonium nitrate (NH4NO3) 3. Prepare increasingly dilute solutions of copper(II) sulfate as shown below, in each instance swirl the beaker to mix the two liquids thoroughly: Beaker 0.050 M CuSO4 (mL) distilled H2O 1 10 0 2 8 2 3 6 4 4 4 6 5 2 8 6 1 9 7 1 19 8 1 49 4. Obtain ten test tubes. Label them 1 through 8. Label the ninth one distilled water and the tenth one "unknown". 5. Pour 5 mL of each prepared solution into its corresponding test tube. Pour 5 mL distilled water into Tube 9. 6. Add 100 ul of the ammonia solution to tubes 1 through 8. Cover and invert. (Caution: Avoid inhaling the ammonia; keep the dropper bottle stoppered.) 7. Each lab partner should make one additional tube of CuSO 4, water and ammonia, as described above, that the other partner will use as his/her unknown. Choose a mixture somewhere between those used for beakers 5 through 8, and don’t be afraid to use fractions (e.g., 2.5 ml CuSO4, 7.5 ml water). 8. Using instructions for the operation of your spectrophotometer, a) Determine the wavelength to be used: perform a preliminary wavelength scan (350 nm – 750 nm) on one of your samples with an intermediate concentration. b) Find the wavelength at which the sample has maximum absorbance – use this wavelength for measuring all of your samples 9. Load a microplate with 250 ul of each of your samples and 250 ul of a blank (10 ml water + 100 ul ammonia solution). 10. Measure the Abs. for the samples in your plate using the selected wavelength 11. Dispose of all solutions in the marked container. Wash all glassware. Rinse with distilled water. 12. Wash hands thoroughly before leaving the laboratory. Data Analysis and Concept Development 1. Calculate the concentration of Cu(NH3)42+ ion in each test tube. Use the formula Volume1•Concentration1 = Volume2•Concentration2. For example, Tube 2: 8 mL/10 mL x 0.050 M = 0.040 M. Record these calculated values on your data chart. 2. Use Excel to plot a graph of [Abs – blank] vs. concentration of Cu(NH3)42+, plotting Abs on the vertical axis. 3. What does this graph tell you about the relationship between percent transmittance and concentration? 4. If you need more data to produce a smooth curve prepare additional concentrations of the copper(II) ion. Measure the Abs and add these values to your graph. 5. Readings above 2 O.D. are unreliable. From your graph determine the lowest concentration limit of Cu(NH3)42+ ion detectable by this procedure. 6. Using the graph just completed and the Abs reading for your unknown, determine the unknown copper(II) ion concentration.
