Unit 2 Day 2 Notes - Garnet Valley School District
advertisement
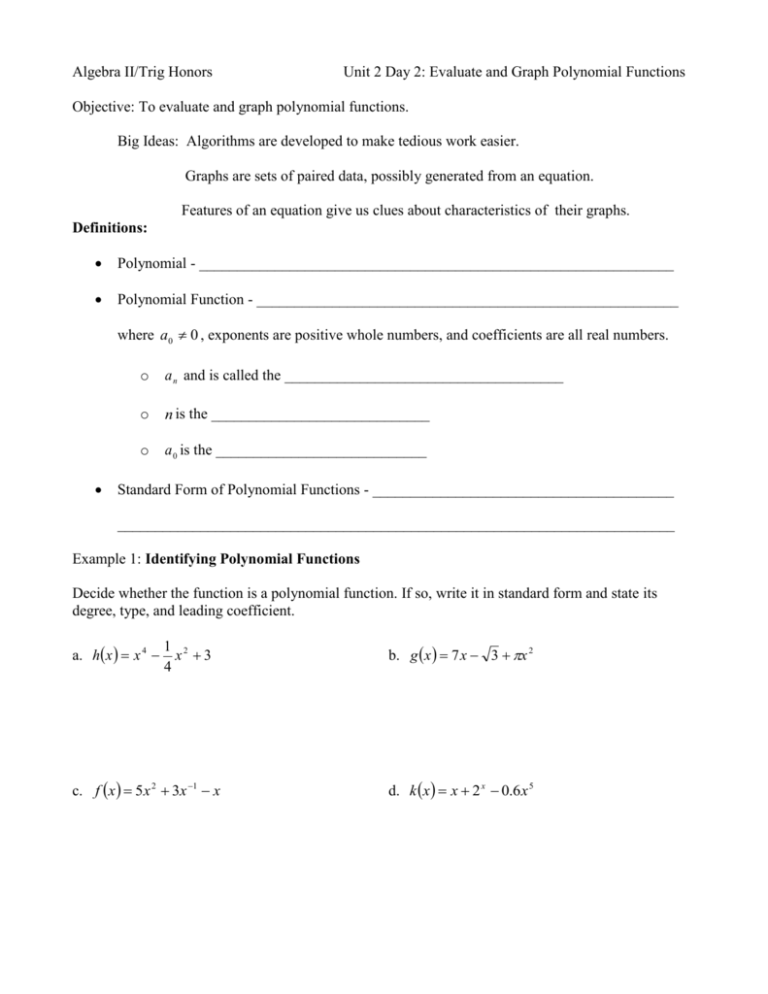
Algebra II/Trig Honors Unit 2 Day 2: Evaluate and Graph Polynomial Functions Objective: To evaluate and graph polynomial functions. Big Ideas: Algorithms are developed to make tedious work easier. Graphs are sets of paired data, possibly generated from an equation. Features of an equation give us clues about characteristics of their graphs. Definitions: Polynomial - _______________________________________________________________ Polynomial Function - ________________________________________________________ where a0 0 , exponents are positive whole numbers, and coefficients are all real numbers. o a n and is called the _____________________________________ o n is the _____________________________ o a 0 is the ____________________________ Standard Form of Polynomial Functions - ________________________________________ __________________________________________________________________________ Example 1: Identifying Polynomial Functions Decide whether the function is a polynomial function. If so, write it in standard form and state its degree, type, and leading coefficient. a. h x x 4 1 2 x 3 4 c. f x 5x 2 3x 1 x b. g x 7 x 3 x 2 d. k x x 2 x 0.6 x 5 Example 2: Evaluate by Direct Substitution Use direct substitution to evaluate f x 2 x 4 5x 3 4 x 8 when x 3 Another way to evaluate a polynomial function is to use ___________________________. o This method requires fewer operations than direct substitution. Example 3: Synthetic Substitution Use synthetic substitution to evaluate f x 2 x 4 5x 3 4 x 8 when x 3 . Your answer should match the answer in the previous example. 1. Write the coefficients of f x in order of descending exponents. Write the value at which f x is being evaluated to the left. 2. Bring down the leading coefficient. Multiply the leading coefficient by the x-value. Write the product under the second coefficient. Add. 3. Multiply the previous sum by the x-values. Write the product under the third coefficient. Add. Repeat for all of the remaining coefficients. The final sum is the value of f x at the given value. End Behavior - _______________________________________________________________ ____________________________________________________________________________ o For polynomial functions, the end behavior is determined by the function’s degree and the sign of its leading coefficients. **The expression x is read as “x approaches positive infinity” Example 4: End Behavior What is true about the degree and leading coefficient of the polynomial function whose graph is shown? Degree is odd or even? ___________________ Leading coefficient is positive or negative? ___________________ Graphing Polynomial Functions o First plot points to determine the shape of the graph’s middle portion. o Then use what you know about end behavior to sketch the ends of the graph. Example 5: Graph Polynomial Functions a. Graph f x x 3 x 2 3x 3 1. Make a table of values and plot the corresponding points. 2. Connect the points with a smooth curve and check the end behavior. b. Graph f x x 4 x 3 4 x 2 4 Example 6: The energy E (in foot-pounds) in each square foot of a wave is given by the model E 0.0029 s 4 where s is the wind speed (in knots). Graph the model. Use the graph to estimate the wind speed needed to generate a wave with 1000 foot-pounds of energy per square foot. HW: Page 99 #3-8, 9-21 (M3), 25-35 odd, 39-48 (M3), 54
