file - Genome Biology
advertisement
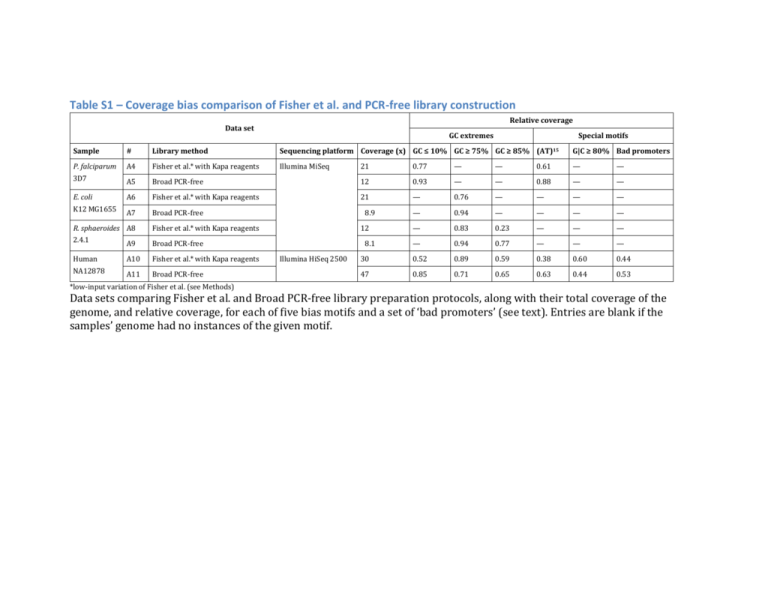
Table S1 – Coverage bias comparison of Fisher et al. and PCR-free library construction Relative coverage Data set GC extremes Special motifs Sample # Library method Sequencing platform Coverage (x) GC ≤ 10% GC ≥ 75% GC ≥ 85% (AT)15 G|C ≥ 80% Bad promoters P. falciparum A4 Fisher et al.* with Kapa reagents Illumina MiSeq 3D7 A5 E. coli K12 MG1655 21 0.77 — — 0.61 — — Broad PCR-free 12 0.93 — — 0.88 — — A6 Fisher et al.* with Kapa reagents 21 — 0.76 — — — — A7 Broad PCR-free 08.9 — 0.94 — — — — R. sphaeroides A8 Fisher et al.* with Kapa reagents 12 — 0.83 0.23 — — — 2.4.1 A9 Broad PCR-free 08.1 — 0.94 0.77 — — — Human A10 Fisher et al.* with Kapa reagents 30 0.52 0.89 0.59 0.38 0.60 0.44 NA12878 A11 Broad PCR-free 47 0.85 0.71 0.65 0.63 0.44 0.53 Illumina HiSeq 2500 *low-input variation of Fisher et al. (see Methods) Data sets comparing Fisher et al. and Broad PCR-free library preparation protocols, along with their total coverage of the genome, and relative coverage, for each of five bias motifs and a set of ‘bad promoters’ (see text). Entries are blank if the samples’ genome had no instances of the given motif. Table S2 – Comparison of human sequencing error rate using a sample-specific reference Sample # Human NA12878 14 14 15 15 Sequencing platform Illumina HiSeq v3 Ion Torrent PGM Reference Mismatches Deletions Insertions Total Human assembly 19 Gerstein diploid NA12878 Human assembly 19 Gerstein diploid NA12878 0.0030 0.0018 0.0048 0.0048 0.00023 0.000052 0.0063 0.0062 0.00017 0.000027 0.0050 0.0049 0.0031 0.0019 0.016 0.016 The error rates computed for Illumina HiSeq and Ion Torrent PGM sequencing of human sample NA12878 aligned to the standard human reference (Human assembly 19 / GRCh37) and aligned to a diploid NA12878-specific reference (Gerstein Lab, available at http://sv.gersteinlab.org/NA12878_diploid/NA12878_diploid_dec16.2012.zip). Note that the Ion Torrent data were aligned to both references using BWA-SW, rather than the TMAP aligner used in the main text of the paper (see Methods). Table S3 – Error rate comparison of Fisher et al. and PCR-free library construction Sample P. falciparum 3D7 # Library method A4 Fisher et al.* with Kapa reagents A5 Broad PCR-free E. coli K12 A6 Fisher et al.* with Kapa reagents MG1655 A7 Broad PCR-free R. sphaeroides A8 Fisher et al.* with Kapa reagents 2.4.1 A9 Broad PCR-free Human NA12878 A10 Fisher et al.* with Kapa reagents A11 Broad PCR-free *low-input variation of Fisher et al. (see Methods) Mismatches 0.0026 0.0025 0.0022 0.0023 0.0030 0.0028 0.0027 0.0043 Deletions 0.00028 0.00013 0.0000095 0.000012 0.000013 0.000016 0.00027 0.00023 Insertions 0.00015 0.000057 0.0000048 0.0000051 0.000010 0.0000089 0.00020 0.00018 Total 0.0031 0.0027 0.0022 0.0023 0.0030 0.0028 0.0032 0.0047 The error rates of microbial and human libraries created with the low-input Fisher et al. library construction protocol (with Kapa reagents) and the Broad PCR-free protocol. The microbial libraries (data sets #A4-A9) were sequenced on the same MiSeq flowcell, the human libraries (data sets #A10 and #A11) were sequenced on separate, but closely matched, HiSeq 2500 flowcells.
