Appendix F Data on self-represented litigants (Word
advertisement

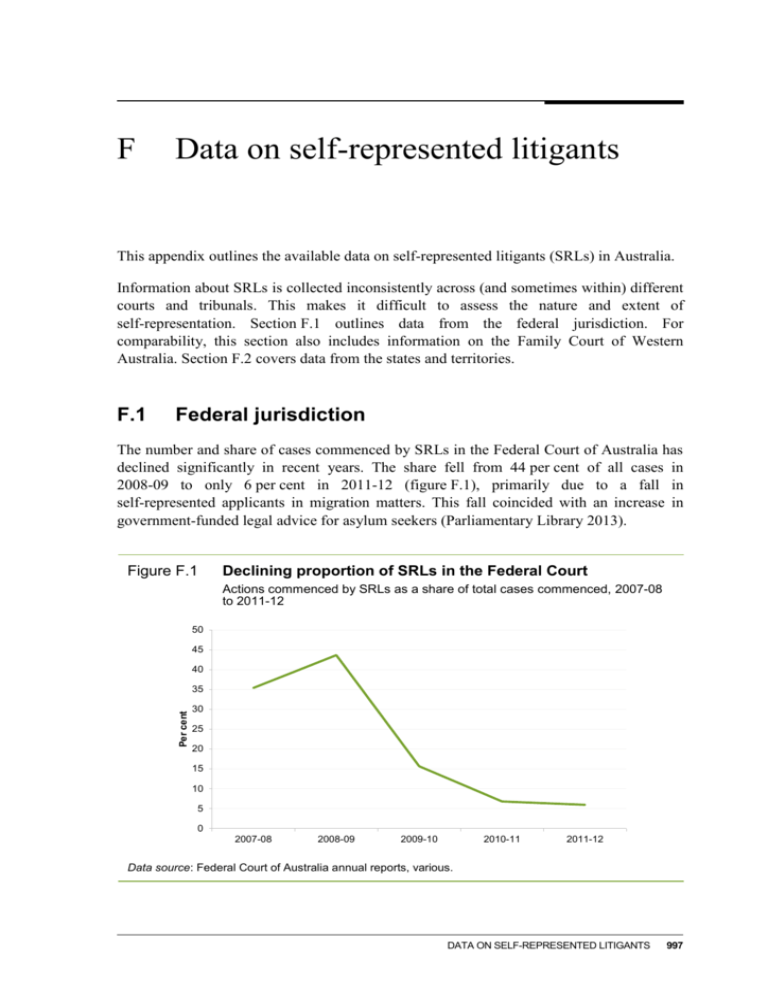
F Data on self-represented litigants This appendix outlines the available data on self-represented litigants (SRLs) in Australia. Information about SRLs is collected inconsistently across (and sometimes within) different courts and tribunals. This makes it difficult to assess the nature and extent of self-representation. Section F.1 outlines data from the federal jurisdiction. For comparability, this section also includes information on the Family Court of Western Australia. Section F.2 covers data from the states and territories. F.1 Federal jurisdiction The number and share of cases commenced by SRLs in the Federal Court of Australia has declined significantly in recent years. The share fell from 44 per cent of all cases in 2008-09 to only 6 per cent in 2011-12 (figure F.1), primarily due to a fall in self-represented applicants in migration matters. This fall coincided with an increase in government-funded legal advice for asylum seekers (Parliamentary Library 2013). Figure F.1 Declining proportion of SRLs in the Federal Court Actions commenced by SRLs as a share of total cases commenced, 2007-08 to 2011-12 50 45 40 Per cent 35 30 25 20 15 10 5 0 2007-08 2008-09 2009-10 2010-11 2011-12 Data source: Federal Court of Australia annual reports, various. DATA ON SELF-REPRESENTED LITIGANTS 997 Migration disputes continue to comprise a large share of self-represented cases in the Federal Court of Australia. Over 60 per cent of proceedings commenced by SRLs in the last few years were appeals and related actions. Of the appeals commenced by SRLs, around 70 per cent related to migration matters (figure F.2). Figure F.2 SRLs in the Federal Court mostly appeal migration decisions Proceedingsa and appealsb commenced by SRLs, by cause of action and year Appeals 70 60 50 40 30 20 10 0 Per cent Per cent Proceedings 2009-10 2010-11 80 70 60 50 40 30 20 10 0 2011-12 2009-10 2010-11 2011-12 a ‘Other’ includes admiralty, assisted dispute resolution, bills of costs, competition law, consumer protection, cross claim, fair work, industrial, intellectual property, migration, miscellaneous, native title, and taxation. b ‘Other’ includes admiralty, competition law, consumer protection, corporations, fair work, human rights, industrial, intellectual property, miscellaneous, and taxation. Data source: Federal Court of Australia annual reports, various. Changes in data reporting make comparisons over a longer period of time difficult. Earlier Federal Court annual reports included the number and proportion of actions commenced in which either the applicant or respondent were self-represented. According to this measure, there has been some variation over time in the share of total cases involving at least one SRL. At least one party was an SRL in 28 per cent of filings in 1998-99, increasing to 40 per cent in 2001-02, and falling to 34 per cent in 2003-04 (figure F.3). Self-representation is also common in the Family Court of Australia. Between 30-40 per cent of matters involve litigants who self-represent at some point in their proceedings (Family Court of Australia 2003). The proportion of SRLs for both finalised cases and trials has fallen in recent years (figure F.4). By contrast, the proportion of self-represented appellants has remained steady over the last decade, at around 40 to 50 per cent (figure F.5). Cases involving an SRL in the Family Court (at both first instance and on appeal) are much more likely to: 998 involve only children’s matters (rather than property matters) ACCESS TO JUSTICE ARRANGEMENTS be of shorter duration finalise earlier in the process (Family Court of Australia 2003; Hunter, Giddings and Chrzanowski 2003). Figure F.3 Federal Court — self-represented applicants and respondents Actions commenced in which at least one party was an SRL, 1998-99 to 2003-04 No Unknown Yes 4000 60 3500 50 Per cent of total filings Number of filings Yes 3000 2500 2000 1500 1000 No Unknown 40 30 20 10 500 0 0 Data source: Federal Court of Australia annual reports, various. Figure F.4 Proportion of SRLs in the Family Court is decreasing Proportion of litigants by representation status, 2003-04 to 2011-12 Finalised cases Per cent 80 100 Both SRL One SRL 80 Per cent 100 Trials 60 40 20 One SRL 60 40 20 No SRL 0 Both SRL No SRL 0 Data source: Family Court of Australia annual reports, various. DATA ON SELF-REPRESENTED LITIGANTS 999 Figure F.5 Self-represented appellants in the Family Court Proportion of appellants who are self-represented, 1996-97 to 2011-12 60 50 Per cent 40 30 20 10 0 Data source: Family Court of Australia annual reports, various. In the Family Court of Western Australia between 2007-08 and 2012-13, the share of cases involving self-represented applicants increased in financial cases (7 per cent to 32 per cent) and in final order parenting applications (40 to 50 per cent), while the proportion of self-represented applicants for divorce matters was steady at around 80 per cent (figure F.6). Figure F.6 Self-representation in the Family Court of Western Australia Self-represented applicants by case type, 2007-08 to 2012-13 90 Divorce applications 80 70 Per cent 60 Final order parenting applications 50 40 Financial cases 30 20 10 0 2007-08 2008-09 2009-10 2010-11 Data source: Family Court of Western Australia annual reviews, various. 1000 ACCESS TO JUSTICE ARRANGEMENTS 2011-12 2012-13 A high proportion of divorce applicants in the Family Court of Australia are also self-represented. Published data from the late 1990s suggest that around 70 per cent of applicants self-represented — more than twice the level of the early 1980s (figure F.7). The Federal Circuit Court does not publish data on self-representation in relation to divorce. Figure F.7 Most divorce applicants in the Family Court self-represent Per cent of divorce applicants who are self-represented 80 70 Per cent 60 50 40 30 20 10 0 Data source: Family Court of Australia (1999). According to the Federal Circuit Court (FCC) a significant number of parties self-represent, particularly in the areas of family law, child support, bankruptcy and migration, although the Court’s database only captures SRLs in finalised applications for final orders in family law (FCC 2013). Over the past four years, over 30 per cent of family law final applications had at least one SRL (figure F.8). Although there are no published data, the FCC said that the divorce jurisdiction also attracts a significant number of SRLs (FCC 2013). Rates of self-representation are typically much higher in tribunals — which is expected, given that most tribunals actively encourage and accommodate self-represented parties (chapter 10). In the Administrative Appeals Tribunal (AAT), almost half of all individuals with cases finalised in 2012-13 were self-represented (sub. 65). The rate of self-representation varied across matter types, with the highest rates recorded for social security, and citizenship and immigration cases (figure F.9). The lowest rates were recorded for veterans’ affairs and workers’ compensation cases — according to the AAT, this is in part due to greater access to legal aid for veterans’ affairs cases, and the fact that costs awards can be made in workers’ compensation cases. DATA ON SELF-REPRESENTED LITIGANTS 1001 Figure F.8 Representation in the Federal Circuit Court Family law final applications by party representation, finalised in year 100 90 80 Per cent 70 Only respondent has legal representation 60 50 Only applicant has legal representation 40 Neither have legal representation 30 Both have legal representation 20 10 0 2009-10 2010-11 2011-12 2012-13 Data source: Federal Circuit Court of Australia annual reports, various. Figure F.9 Representation of individuals in the AAT By jurisdiction, per cent of all cases finalised in 2012-13a Citizenship & Immigration Self-represented Social Security Taxation Private Lawyer, CLC or Legal Aid Veterans' Affairs Workers' Compensation Accountant/Tax/ Migration Agent, or Other Advocate Other Total Friend/Relative/ Other 0 20 40 Per cent 60 80 a The data reflect representation status when the application was finalised. They do not include information about the representation of parties who were not individuals (that is, companies, associations or other organisations). Data source: AAT case management system (sub. 65). 1002 ACCESS TO JUSTICE ARRANGEMENTS F.2 States and territories State and territory-level data on SRLs are less comprehensive relative to the federal jurisdictions. In Victoria, the Supreme Court of Victoria publishes the number of contacts made with its SRL Coordinator, without separating criminal and civil matters. Data supplied to the Commission by the Supreme Court show that the proportion of applications filed in its Court of Appeal by SRLs has increased over time from 8 per cent in 2001 to 13 per cent in 2008, and remaining above 20 per cent over the last four years (figure F.10; sub. DR324). While the Court also collects information on the types of matters involving SRLs, this information is not published. Information provided by the County Court of Victoria (pers. comm., 21 August 2014) suggests that approximately 65 to 70 per cent of SRLs in that Court appear in matters before the Commercial List. Figure F.10 Court of Appeal, Supreme Court of Victoria Per cent of matters in civil appeal jurisdiction commenced by SRLs, by year 30 25 Per cent 20 15 10 5 0 2001 2002 2003 2004 2005 2006 2007 2008 2009 2010 2011 2012 2013 Data source: Unpublished data provided by the Supreme Court of Victoria. In Queensland, only the Supreme Court publishes numbers of SRLs, and only for its Court of Appeal. Queensland Public Interest Law Clearing House (sub. 58) noted that while all documents filed in Queensland courts contain information about self-representation, this information is not published. The share of civil cases heard in the Queensland Court of Appeal in which one or both parties are self-represented has varied over time (figure F.11). On average around 34 per cent of matters have had at least one SRL since 2000-01. DATA ON SELF-REPRESENTED LITIGANTS 1003 Figure F.11 SRLs in the Supreme Court of Queensland Court of Appeal, civil cases with at least one party self-represented, by year 120 50 40 Per cent 80 60 40 30 20 20 10 0 0 1995-96 1996-97 1997-98 1998-99 1999-00 2000-01 2001-02 2002-03 2003-04 2004-05 2005-06 2006-07 2007-08 2008-09 2009-10 2010-11 Number of cases 100 Data source: Supreme Court of Queensland annual reports, various. While there are no firm figures across all Western Australian courts, of the 41 048 matters lodged in the Civil Registry of the Magistrates Court in 2008-09, one or more parties were self-represented in 98 per cent of matters at lodgement and in 53 per cent of hearings (excluding residential tenancy matters) (WA DAG 2009). The Supreme Court of Western Australia said that it lacked the capacity to record meaningful data on the numbers of SRLs or their characteristics, but noted that self-representation is the norm in the Court’s probate jurisdiction. The ACT Magistrates Court was unable to provide the Commission with data on SRLs. The Commission understands that the main jurisdiction in which the Court experiences SRLs is in protection order matters. The Tasmanian Supreme Court noted that it does not collect data on the numbers of SRLs in civil matters. However, it said that the majority of SRLs before the Court appear in mortgagee possession matters, which tend to resolve quickly in the Associate Judge’s court. The Northern Territory Magistrates Court (sub. 331) said that it was in the process of collating data on SRLs and developing appropriate information systems to assist SRLs in the conduct of court cases, and it is hoped that this project will be completed by the end of 2014. Data on self-representation in state and territory tribunals are difficult to obtain (chapter 10). Data was not available from the NSW Civil and Administrative Tribunal (which has only just commenced operation), or from the ACT Civil and Administrative Tribunal or the Victorian Civil and Administrative Tribunal (VCAT) (pers. comm., 7 June 1004 ACCESS TO JUSTICE ARRANGEMENTS and 27 June 2014). Anecdotally, representation in VCAT appears to be less than 20 per cent (VCAT 2014, p. 3). Only 2.5 per cent of parties in the Queensland Civil and Administrative Tribunal were represented in 2012-13 (pers. comm., 4 August 2014). Western Australia’s State Administrative Tribunal indicated that 6 per cent of all parties were represented in 2012-13, although 29 per cent of matters involved a represented party. DATA ON SELF-REPRESENTED LITIGANTS 1005


