key
advertisement
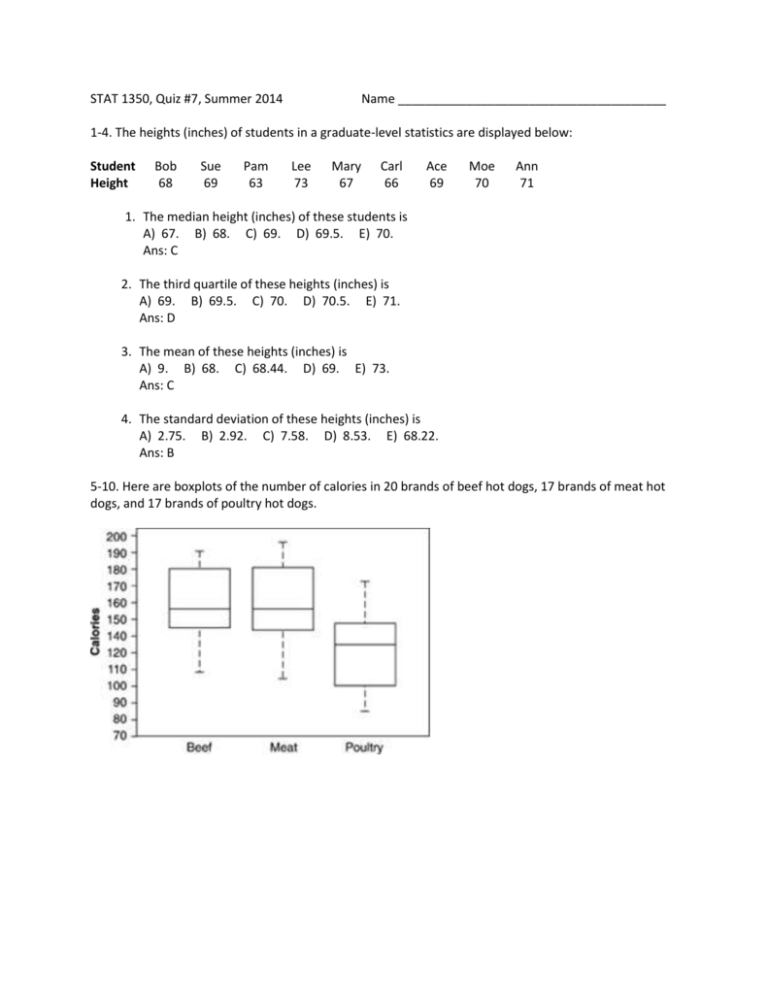
STAT 1350, Quiz #7, Summer 2014 Name _______________________________________ 1-4. The heights (inches) of students in a graduate-level statistics are displayed below: Student Height Bob 68 Sue 69 Pam 63 Lee 73 Mary 67 Carl 66 Ace 69 Moe 70 Ann 71 1. The median height (inches) of these students is A) 67. B) 68. C) 69. D) 69.5. E) 70. Ans: C 2. The third quartile of these heights (inches) is A) 69. B) 69.5. C) 70. D) 70.5. E) 71. Ans: D 3. The mean of these heights (inches) is A) 9. B) 68. C) 68.44. D) 69. E) 73. Ans: C 4. The standard deviation of these heights (inches) is A) 2.75. B) 2.92. C) 7.58. D) 8.53. E) 68.22. Ans: B 5-10. Here are boxplots of the number of calories in 20 brands of beef hot dogs, 17 brands of meat hot dogs, and 17 brands of poultry hot dogs. 5. The main advantage of boxplots over stemplots and histograms is that A) boxplots make it easy to compare several distributions, as in this example. B) boxplots show more detail about the shape of the distribution. C) boxplots use the five-number summary, whereas stemplots and histograms use the mean and standard deviation. D) boxplots show skewed distributions, whereas stemplots and histograms show only symmetric distributions. Ans: A 6. This plot shows that A) all poultry hot dogs have fewer calories than the median for beef and meat hot dogs. B) about half of poultry hot dog brands have fewer calories than the median for beef and meat hot dogs. C) hot dog type is not helpful in predicting calories because some hot dogs of each type are high and some of each type are low. D) most poultry hot dog brands have fewer calories than most beef and meat hot dogs, but a few poultry hot dogs have more calories than the median beef and meat hot dog. Ans: D 7. We see from the plot that the median number of calories in a beef hot dog is about A) 190. B) 179. C) 153. D) 139. E) 129. Ans: C 8. The box in each boxplot marks the A) full range covered by the data. B) range covered by the middle half of the data. C) range covered by the middle three-quarters of the data. D) span one standard deviation on each side of the mean. E) span two standard deviations on each side of the mean. Ans: B 9. The calorie counts for the 17 poultry brands are: 129 132 102 106 94 102 87 99 170 113 135 142 86 143 152 146 144 The median of these values is A) 129. B) 132. C) 130.5. Ans: A D) 121. E) 170. 10. The calorie counts for the 17 poultry brands are: 129 132 102 106 94 102 87 99 170 113 135 142 86 143 152 146 144 The first quartile of the 17 poultry hot dog calorie counts is A) 99. B) 102. C) 100.5. D) 143.5. E) 143. Ans: C
