Chapter 8 - Nonlinear Regression Functions
advertisement

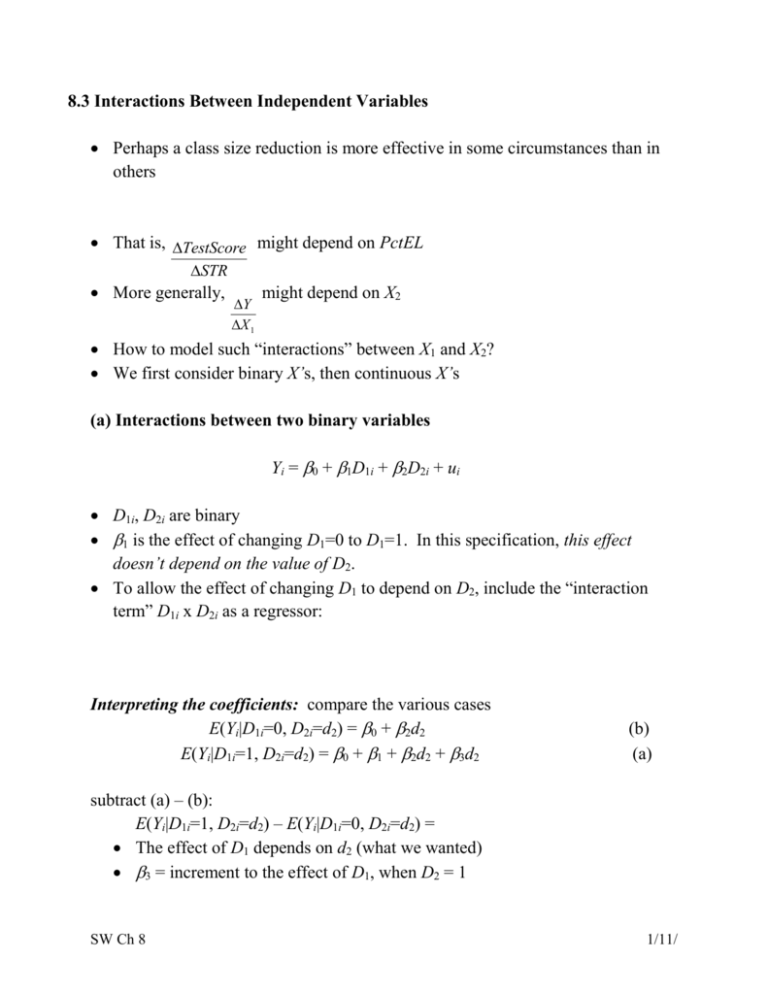
8.3 Interactions Between Independent Variables Perhaps a class size reduction is more effective in some circumstances than in others That is, TestScore might depend on PctEL STR More generally, Y X 1 might depend on X2 How to model such “interactions” between X1 and X2? We first consider binary X’s, then continuous X’s (a) Interactions between two binary variables Yi = 0 + 1D1i + 2D2i + ui D1i, D2i are binary 1 is the effect of changing D1=0 to D1=1. In this specification, this effect doesn’t depend on the value of D2. To allow the effect of changing D1 to depend on D2, include the “interaction term” D1i x D2i as a regressor: Interpreting the coefficients: compare the various cases E(Yi|D1i=0, D2i=d2) = 0 + 2d2 E(Yi|D1i=1, D2i=d2) = 0 + 1 + 2d2 + 3d2 (b) (a) subtract (a) – (b): E(Yi|D1i=1, D2i=d2) – E(Yi|D1i=0, D2i=d2) = The effect of D1 depends on d2 (what we wanted) 3 = increment to the effect of D1, when D2 = 1 SW Ch 8 1/11/ Example: TestScore, STR, English learners Let HiSTR= high student teacher ratio = 1 if STR 20 0 if STR 20 and HiEL = high English Language learners = 1 if PctEL l0 0 if PctEL 10 Test score = 664.1 – 18.2HiEL – 1.9HiSTR – 3.5(HiSTR xHiEL) (1.4) (2.3) (1.9) (3.1) “Effect” of HiSTR when HiEL = 0 is “Effect” of HiSTR when HiEL = 1 is Class size reduction is estimated to have a bigger effect when the percent of English learners is large This interaction isn’t statistically significant: Can you relate these coefficients to the following table of group (“cell”) means? Low EL High EL Low STR 664.1 645.9 High STR 662.2 640.5 (b) Interactions between continuous and binary variables Yi = 0 + 1Di + 2Xi + ui Di is binary, X is continuous As specified above, the effect on Y of X (holding constant D) = 2, which does not depend on D To allow the effect of X to depend on D, include the “interaction term” DiXi as a regressor: SW Ch 8 2/11/ Observations with Di= 0 (the “D = 0” group): Observations with Di= 1 (the “D = 1” group): SW Ch 8 3/11/ Interpreting the coefficients Yi = 0 + 1Di + 2Xi + 3(Di x Xi) + ui General rule: compare the various cases Y = 0 + 1D + 2X + 3(D x X) Now change X: Y + Y = 0 + 1D + 2(X+X) + 3[D x (X+X)] subtract (a) – (b): Y = 2X + 3DX (b) (a) The effect of X depends on D (what we wanted) 3 = Example: TestScore, STR, HiEL (=1 if PctEL ≥ 10) Test score = 682.2 – 0.97STR + 5.6HiEL – 1.28(STR x HiEL) (11.9) (0.59) (19.5) (0.97) When HiEL = 0: Test score = 682.2 – 0.97STR When HiEL = 1, Test score = 682.2 – 0.97STR + 5.6 – 1.28STR = 687.8 – 2.25STR SW Ch 8 4/11/ Test score = 682.2 – 0.97STR + 5.6HiEL – 1.28(STR x HiEL) (11.9) (0.59) (19.5) (0.97) The two regression lines have the same slope The two regression lines have the same intercept The two regression lines are the same We reject the joint hypothesis but neither individual hypothesis (how can this be?) (c) Interactions between two continuous variables Yi = 0 + 1X1i + 2X2i + ui X1, X2 are continuous As specified, the effect of X1 doesn’t depend on X2 As specified, the effect of X2 doesn’t depend on X1 To allow the effect of X1 to depend on X2, include the “interaction term” X1i x X2i as a regressor: Interpreting the coefficients: Y = 0 + 1X1 + 2X2 + 3(X1 x X2) Change X1: Y + Y = 0 + 1(X1+X1) + 2X2 + 3[(X1+X1)X2] subtract (a) – (b): Y = 1X1 + 3X2X1 (b) (a) The effect of X1 depends on X2 (what we wanted) 3 = increment to the effect of X1 from a unit change in X2 SW Ch 8 5/11/ Example: TestScore, STR, PctEL Test score = 686.3 – 1.12STR – 0.67PctEL + .0012(STR x PctEL), (11.8) (0.59) (0.37) (0.019) The estimated effect of class size reduction is nonlinear because the size of the effect itself depends on PctEL: TestScore = STR PctEL TestScore STR 0 20% Testscore = 686.3 – 1.12STR – 0.67PctEL + .0012(STR x PctEL), (11.8) (0.59) (0.37) (0.019) Is the population coefficient on STR x PctEL = 0? Is the population coefficient on STR = 0? Is the the coefficients on both STR and STR x PctEL = 0? SW Ch 8 6/11/ 8.4 Application: Nonlinear Effects on Test Scores of the Student-Teacher Ratio Nonlinear specifications let us examine more nuanced questions about the Test score – STR relation, such as: 1. Are there nonlinear effects of class size reduction on test scores? 2. Are there nonlinear interactions between PctEL and STR? Strategy for Question #1 (different effects for different STR?) Estimate linear and nonlinear functions of STR, holding constant relevant demographic variables o PctEL o Income (remember the nonlinear TestScore-Income relation!) o LunchPCT (fraction on free/subsidized lunch) See whether adding the nonlinear terms makes an “economically important” quantitative difference (“economic” or “real-world” importance is different than statistically significant) Test for whether the nonlinear terms are significant Strategy for Question #2 (interactions between PctEL and STR?) Estimate linear and nonlinear functions of STR, interacted with PctEL. If the specification is nonlinear (with STR, STR2, STR3), then you need to add interactions with all the terms so that the entire functional form can be different, depending on the level of PctEL. We will use a binary-continuous interaction specification by adding HiELSTR, HiELSTR2, and HiELSTR3. SW Ch 8 7/11/ What is a good “base” specification? The TestScore – Income relation: The logarithmic specification is better behaved near the extremes of the sample, especially for large values of income. SW Ch 8 8/11/ SW Ch 8 9/11/ What can you conclude about question #1? About question #2? Interpreting the regression functions via plots: First, compare the linear and nonlinear specifications: SW Ch 8 10/11/ Next, compare the regressions with interactions: Summary: Nonlinear Regression Functions Using functions of the independent variables such as ln(X) or X1X2, allows recasting a large family of nonlinear regression functions as multiple regression. Estimation and inference proceed in the same way as in the linear multiple regression model. Interpretation of the coefficients is model-specific, but the general rule is to compute effects by comparing different cases (different value of the original X’s) Many nonlinear specifications are possible, so you must use judgment: o What nonlinear effect you want to analyze? o What makes sense in your application? SW Ch 8 11/11/


