Analysis for NCATE
advertisement
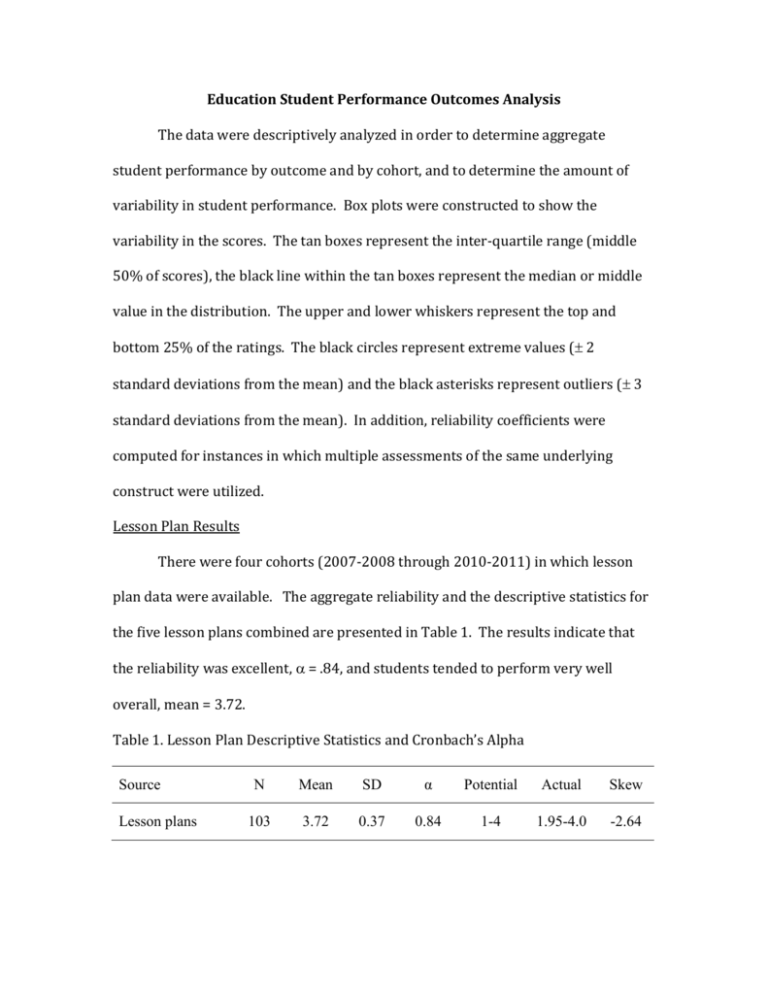
Education Student Performance Outcomes Analysis The data were descriptively analyzed in order to determine aggregate student performance by outcome and by cohort, and to determine the amount of variability in student performance. Box plots were constructed to show the variability in the scores. The tan boxes represent the inter-quartile range (middle 50% of scores), the black line within the tan boxes represent the median or middle value in the distribution. The upper and lower whiskers represent the top and bottom 25% of the ratings. The black circles represent extreme values ( 2 standard deviations from the mean) and the black asterisks represent outliers ( 3 standard deviations from the mean). In addition, reliability coefficients were computed for instances in which multiple assessments of the same underlying construct were utilized. Lesson Plan Results There were four cohorts (2007-2008 through 2010-2011) in which lesson plan data were available. The aggregate reliability and the descriptive statistics for the five lesson plans combined are presented in Table 1. The results indicate that the reliability was excellent, = .84, and students tended to perform very well overall, mean = 3.72. Table 1. Lesson Plan Descriptive Statistics and Cronbach’s Alpha Source Lesson plans N Mean SD α Potential Actual Skew 103 3.72 0.37 0.84 1-4 1.95-4.0 -2.64 Student performance by cohort and lesson plan component is featured in Figure 1. The results indicate that the assessment component was a relative weakness, and instructional strategies and materials were both relative strengths. However, students tended to perform well across all five lesson plan components across all four cohorts. Figure 1. Student performance by lesson plan component and cohort. The ratings are based on a 4-point scale ranging from a low of 1.0 and a high of 4.0. Figure 2 shows the variability in student performance for the 2007-2008 cohort. The results indicate that there were outliers in four out of the five components, with the exception of the assessment component, and the variability in the assessment ratings was relatively large and the distribution was relatively symmetrical (not heavily skewed to the right or left). With regard to instructional strategies and materials, students tended to earn a score of 4.0, with a few students falling below a 4.0, resulting in the negative skews. Figure 2. Box plots for 2007-2008 cohort by lesson plan component. The distributional characteristics for the 2008-2009 cohort are featured in Figure 3. The results indicate that there were outliers in four out of the five components with the exception of the assessment component, and the variability in the assessment ratings was relatively large with a somewhat negatively skewed distribution. With regard to instructional strategies and materials, students tended to earn a score of 4.0, with some students falling below a 4.0, resulting in the negative skews. In fact, all five distributions had negative skews. Figure 3. Box plots for 2008-2009 cohort by lesson plan component. The results for the 2009-2010 cohort, presented in Figure 4, show more variability in general than the previous cohorts, and fewer outliers. The assessment component yielded the most variability again, and students tended to earn a score of 4.0 for the materials component, with a few students falling below a 4.0, resulting in a negative skew. Again, all five components had negatively skewed distributions. Figure 4. Box plots for 2009-2010 cohort by lesson plan component. Finally, the distributional characteristics for the 2010-2011 cohort are featured in Figure 5. The results indicate that all five of the distributions were negatively skewed, and four of the five components had outliers. The results also indicate that while the assessment component had more variability than the remaining components, the variability was smaller for the 2010-2011 cohort in comparison to the earlier cohorts. Figure 5. Box plots for 2010-2011 cohort by lesson plan component. Figure 6 shows the distributional characteristics based on students’ composite scores (average across all five components) by cohort. The results indicate that when looking at students’ overall lesson plan score, the distributions were more symmetrical (especially for the 2007-2008 and the 2010-2011 cohorts), and there tended to be fewer outliers. Therefore students who scored low on one particular component did not necessarily score low on all five components. Finally, the most favorable outcome was found for the 2010-2011 cohort given the relatively small variability in performance and the relatively high median score. Figure 6. Overall lesson plan distributional characteristics by cohort. INTASC Principle Results There were three cohorts (2007-2008 through 2009-2010) in which INTASC principle data were available. The aggregate reliability and the descriptive statistics for the 10 INTASC principals combined are presented in Table 2. The results indicate that the reliability was fair, = .72, and students tended to perform very well overall, mean = 3.52. The lower reliability indicates that students did not necessarily score consistently low or consistently high across all of the INTASC principles or across all of the categories assessed (knowledge, disposition, and performance). Table 2. INTASC Principle Descriptive Statistics and Cronbach’s Alpha Source N Mean SD α Potential Actual Skew INTASC 66 3.52 0.18 0.72* 1-4 3.2-4.0 0.30 *The reliability coefficient is based on the 2009-2010 cohort only (n = 21). The reliability coefficient is based on the three categories (knowledge, disposition, and performance) for each INTASC principle resulting in a total of 30 measures. Student performance by cohort and INTASC principle is displayed in Figure 7. The results indicate that the relative strengths and weaknesses depend on the cohort and therefore the profiles of the three cohorts were not necessarily consistent. For example, a relative strength for the 2007-2008 cohort was INTASC principle 3, and a relative weaknesses was INTASC principle 4. For the 2008-2009 cohort, INTASC principles 1 and 6 were relative weaknesses and INTASC principle 10 was a relative strength. Finally, for the 2009-2010 cohort, INTASC principle 6 was a relative weakness and INTASC principle 7 was a relative strength. However, it is important to note that all three cohorts showed favorable performance across all 10 INTASC principles on average. Figure 7. Student performance by INTASC principle and cohort. The ratings are based on a 4-point scale ranging from a low of 1.0 and a high of 4.0. Figure 8 shows the variability in student performance for the 2007-2008 cohort. The results indicate that all of the students scored between a value of 3.0 and 4.0 on INTASC principles 2, and 5-10. The results also indicate that almost all of the students earned a score of 4.0 on INTASC principle 3; there were three students who earned a score of 3.0, and they were outliers. Finally, the results indicate that student performance was lowest and most variable with regard to INTASC principle 4. Figure 8. Box plots for 2007-2008 cohort by INTASC principle. The distributional characteristics for the 2008-2009 cohort are featured in Figure 9. The results indicate that all of the students scored between a value of 3.0 and 4.0 on INTASC principles 1, 2, 5-8, and 10. The results also indicate that students had the most variability in their performance relative to INTASC principles 4 and 9. Finally, the results indicate that performance tended to be lowest for INTASC principles 1and 6, and highest for INTASC principles 8 and 10. Figure 9. Box plots for 2008-2009 cohort by INTASC principle. The distributional characteristics for the 2009-2010 cohort are displayed in Figure 10. The results indicate that all of the students scored between a value of 3.0 and 4.0 on all ten of the INTASC principles, and while there were some relatively extreme values (scores falling 2 standard deviations below the mean), there were no outliers. The results also indicate that student performance tended to be lowest for INTASC principles 1, 3 and 6, and highest for INTASC principles 2, 9 and 10. Figure 10. Box plots for 2009-2010 cohort by INTASC principle. Figure 11 displays the distributional characteristics based on students’ composite scores (average across all 10 INTASC principles) by cohort. The results indicate that the distributions were relatively symmetrical, there tended to be few extreme values, and there were no outliers. The results also indicate that there was not a lot of variability in student performance. Finally, the results indicate that when looking at the median performance, the 2007-2008 and the 2009-2010 cohorts had similar performance, while the 2008-2009 cohort had slightly lower performance in comparison. Figure 11. INTASC principle distributional characteristics by cohort. Communication Self-Reflection Results Communication self-reflection data were available for the Fall 2010 cohort only. The aggregate reliability and the descriptive statistics for the three communication outcomes (oral, technology and writing) are presented in Table 3. The results indicate that the reliability was excellent for the oral outcome, = .82, the technology outcome, = .85, and the writing outcome, = .92. The results also indicate that students rated themselves more favorable than unfavorable, but not highly favorable on average. In addition, the results indicate that there was a relatively large amount of variability in the students’ self-ratings. Finally, the distributions were all relatively symmetrical based on the skew values. Table 3. Communication Descriptive Statistics and Cronbach’s Alpha Source N Mean SD α Potential Actual Skew Oral 20 2.78 0.54 0.82 1-4 1.75-3.5 -0.52 Technology 13 2.67 0.75 0.85* 1-4 1.5-4.0 -0.10 Writing 15 2.57 0.67 0.92 1-4 1.5-3.83 0.13 *The reliability coefficient is based on only five of the eight technology outcomes due to a very low response rate for those three outcomes (Technology outcomes 1, 5 and 7). The mean student performance across the four items measuring oral communication is presented in Figure 12. The results indicate that on average, students rated themselves highest on item one, which was XXXXXX and they rated themselves lowest on item two, which was XXXXXX. The results also indicate that students rated themselves, on average, in the middle to upper half of the scale on all four items. However, none of the mean ratings were highly favorable. Figure 12. Student mean performance for oral communication by item. The mean student performance across the eight items measuring technology communication is displayed in Figure 13. The results indicate that on average, students rated themselves highest on item eight, which was Blackboard and they rated themselves lowest on item five, which was Web Quest. The results also indicate that students rated themselves, on average, in the middle to lower half of the scale on all eight items. Therefore in general, students rated themselves somewhat unfavorably with regard to their technology communication abilities. Figure 13. Student mean performance for technology communication by item. Finally, Figure 14 features the mean student ratings across the six items measuring writing communication. The results indicate that on average, students rated themselves highest on item one, which was XXXXXX and they rated themselves lowest on item two, which was XXXXX. The results also indicate that students rated themselves, on average, in the middle to lower half of the scale on all six items. Therefore in general, students rated themselves somewhat unfavorably with regard to their writing communication abilities. Figure 14. Student mean performance for writing communication by item. Disposition Self-Reflection Results Disposition self-reflection data were available for the Fall 2010 and Spring 2010 cohorts. The aggregate reliability and the descriptive statistics for the INTASC principle self-ratings are presented in Table 4. The results indicate that the reliability was excellent, = .95, and students rated themselves very favorably on average. In addition, the results indicate that there was a relatively small amount of variability in the students’ self-ratings, and the distribution was relatively symmetrical based on the skew value. Table 4. Disposition Descriptive Statistics and Cronbach’s Alpha Source N Mean SD α Potential Actual Skew INTASC 36 4.44 0.35 0.95* 1-5 3.78-5.0 -0.19 *The reliability coefficient is based on a total of 19 students given that not all of the 36 students rated themselves on all three dimensions (knowledge, disposition, and performance) across all 11 INTASC principles. Figure 15 displays student performance by cohort and INTASC principle. The results indicate that while both cohorts had favorable to highly favorable selfratings on average, students from the Spring 2010 cohort tended to rate themselves higher in comparison to the students from the Fall 2010 cohort. The results also indicate that both cohorts rated themselves highest on INTASC principle 11, the Fall 2010 cohort had the lowest self-rating on INTASC principles 5 and 6, and the Spring 201 cohort had the lowest self-rating on INTASC principle 5. Figure 15. Student disposition self-ratings by INTASC principle and cohort. The ratings are based on a 5-point scale ranging from a low of 1.0 and a high of 5.0. Figure 16 shows the distributional characteristics for the two cohorts with regard to their composite disposition self-ratings for the INTASC principles combined. The results indicate that the self-ratings for the Fall 2010 cohort were normally distributed, with no extreme values or outliers, and a relatively small amount of variability. The self-ratings for the Spring 2010 cohort were somewhat negatively skewed, given the extreme values and outlier below the mean, and there was a very small amount of variability in the ratings. Figure 16. Disposition self-rating distributional characteristics by cohort.


