Homework Topic 12
advertisement
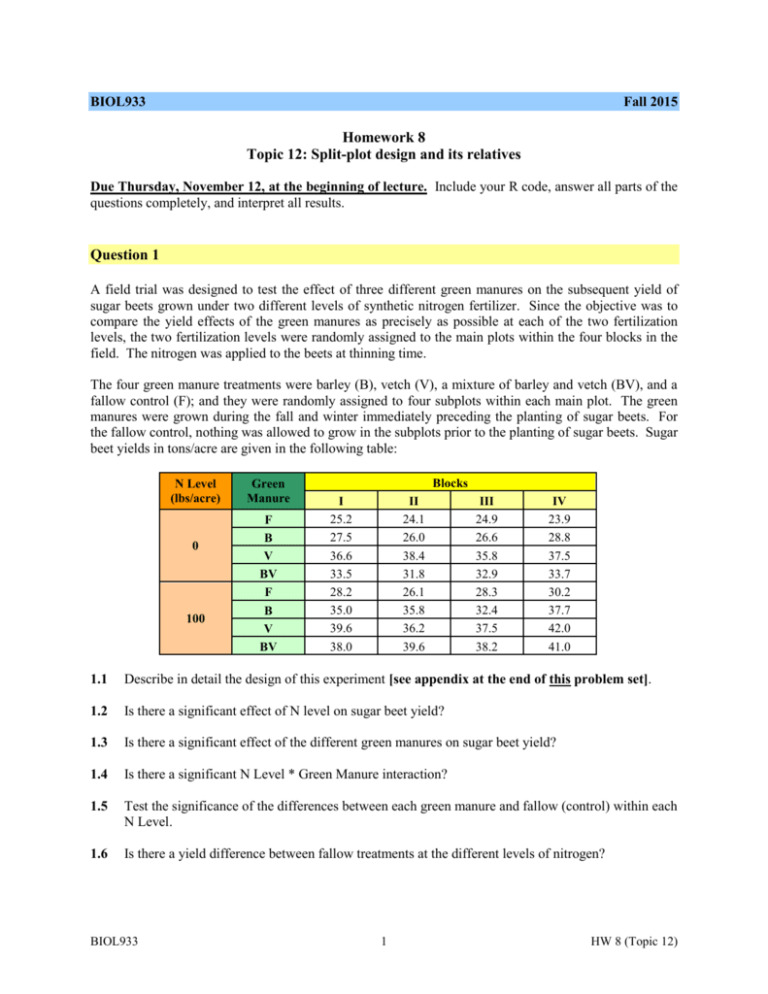
BIOL933 Fall 2015 Homework 8 Topic 12: Split-plot design and its relatives Due Thursday, November 12, at the beginning of lecture. Include your R code, answer all parts of the questions completely, and interpret all results. Question 1 A field trial was designed to test the effect of three different green manures on the subsequent yield of sugar beets grown under two different levels of synthetic nitrogen fertilizer. Since the objective was to compare the yield effects of the green manures as precisely as possible at each of the two fertilization levels, the two fertilization levels were randomly assigned to the main plots within the four blocks in the field. The nitrogen was applied to the beets at thinning time. The four green manure treatments were barley (B), vetch (V), a mixture of barley and vetch (BV), and a fallow control (F); and they were randomly assigned to four subplots within each main plot. The green manures were grown during the fall and winter immediately preceding the planting of sugar beets. For the fallow control, nothing was allowed to grow in the subplots prior to the planting of sugar beets. Sugar beet yields in tons/acre are given in the following table: N Level (lbs/acre) 0 100 Green Manure F B V BV F B V BV Blocks I 25.2 27.5 36.6 33.5 28.2 35.0 39.6 38.0 II 24.1 26.0 38.4 31.8 26.1 35.8 36.2 39.6 III 24.9 26.6 35.8 32.9 28.3 32.4 37.5 38.2 IV 23.9 28.8 37.5 33.7 30.2 37.7 42.0 41.0 1.1 Describe in detail the design of this experiment [see appendix at the end of this problem set]. 1.2 Is there a significant effect of N level on sugar beet yield? 1.3 Is there a significant effect of the different green manures on sugar beet yield? 1.4 Is there a significant N Level * Green Manure interaction? 1.5 Test the significance of the differences between each green manure and fallow (control) within each N Level. 1.6 Is there a yield difference between fallow treatments at the different levels of nitrogen? BIOL933 1 HW 8 (Topic 12) 1.7 Is there a yield difference between BV (Barley + Vetch) at N = 0 and B (Barley) at N = 100? [Use LSD; you need to do the calculations by hand.] If you wished to do a Tukey comparison instead of an LSD, what would you change in the procedure you just went through? [Don't actually do it, just state what would be different in the procedure. Tip: What about your first analysis made it LSD?] Question 2 This experiment was designed to investigate the interaction effect between nitrogen fertilization regimes and irrigation methods on sorghum yields. The logistics of field operations dictated that the irrigation methods (2 levels: I1, I2) be randomized first; the nitrogen levels (3 levels: N1, N2, N3) were then applied randomly as strips across the irrigation methods. The field layout and the resultant sorghum yields are shown below: N2 N3 N1 I1 83.7 96.0 82.5 I2 91.1 94.8 89.9 N3 N2 N1 I1 93.6 83.7 75.1 I2 98.5 91.1 88.6 N3 N1 N2 I2 99.7 92.3 96.0 I1 94.8 77.6 82.5 N1 N3 N2 I1 71.4 92.3 77.6 I2 84.9 91.1 87.4 2.1 Describe in detail the design of this experiment [see appendix at the end of this problem set]. 2.2 Present the ANOVA table for this experiment, including the appropriate F-tests for fertilization regime, irrigation method, and the interaction between these two factors. 2.3 Assume that N1 = 0 lbs/acre, N2 = 50 lbs/acre, and N3 = 100 lbs/acre. Characterize the relationship between nitrogen dosage and sorghum yield (e.g. linear, quadratic, etc.)… a. …for the experiment as a whole. [Remember to specify the appropriate error term!] b. …for each irrigation method separately. [Hint: Run individual ANOVAs with the appropriate contrasts and again make sure to use the right error term!] Which of the two analyses (a or b) would you report in this case? Question 3 The Quack-O Modern Diets Institute carried out an experiment to evaluate the weight-loss effects of three exciting new fad diets (to be released in summer 2016!). The three diets were assigned randomly to nine subjects who adhered to their assigned diets for four weeks. A measure of each subject's weight was taken at the end of each week. BIOL933 2 HW 8 (Topic 12) The table below shows the four weight measurements for each of the nine subjects in the trial. The weight measurements are expressed as percent deviations from the subjects' initial weights. The three diets tested were: Fiber-Flush!™ (F): FDA recommended diet plus 10 servings of dried fruit each day Hydro-Cleanse! ™ (H): FDA recommended diet plus 4 liters of water each day Bananamania! ™ (B): A daily diet consisting of only 15 bananas, 2 liters of water, and a Banana HyperMegaProtein Shake™ (with spirulina, of course). Diet Subject F F F H H H B B B 9 5 2 4 7 1 6 3 8 Weight Change (% of initial) Week 1 Week 2 Week 3 Week 4 1.4 3.0 1.7 0.5 -0.3 -4.0 -5.0 -3.0 -1.7 -0.2 0.2 -1.4 -2.2 -2.0 -6.2 -3.5 1.4 -2.2 -1.0 -2.1 2.9 -1.5 -4.1 -1.0 1.7 1.4 2.1 -3.5 -2.2 -6.2 -3.9 -8.4 0.1 -1.9 -4.6 -8.3 3.1 Describe in detail the design of this experiment [see appendix at the end of this problem set]. 3.2 Analyze the data from this experiment in the following three ways: a. Generate an ANOVA table assuming no correlation among the weight measurements of a given individual (i.e. an ANOVA with full degrees of freedom). b. Generate an ANOVA table assuming perfect correlation (i.e. an ANOVA with conservative degrees of freedom). c. Present ANOVA tables for mainplot (Diet) and subplot (Time) effects using the ezANOVA() function. Present the Sphericity test result and comment on its meaning. Using these results (a-c), answer the following questions (3.3 – 3.6): 3.3 Are there significant differences among the three fad diets in terms of their weight-loss effect? [i.e. Is there a significant main effect of Diet?] 3.4 Was there significant weight loss by individual subjects over the course of the study? [i.e. Is there a significant effect of Time?] 3.5 Do the different diets cause individuals to lose weight differently? 3.6 Present an interaction plot between the mainplot and subplot effects, putting the subplot levels along the x-axis. Use this plot to help you express in words the largest likely component of the Mainplot*Subplot interaction. BIOL933 3 HW 8 (Topic 12) Appendix When you are asked to "describe in detail the design of this experiment," please do so by completing the following template: Design: Response Variable: Experimental Unit: Class Variable 1 2 ↓ n Block or Treatment Subsamples? Number of Levels Fixed or Random Description YES / NO NOTICE: There is a new column in the above table ("Fixed or Random"). Now, for each class variable in your model, you need to indicate if it is a "Fixed" effect or a "Random" effect. BIOL933 4 HW 8 (Topic 12)


