Lesson 10: Interpreting Graphs of Proportional
advertisement
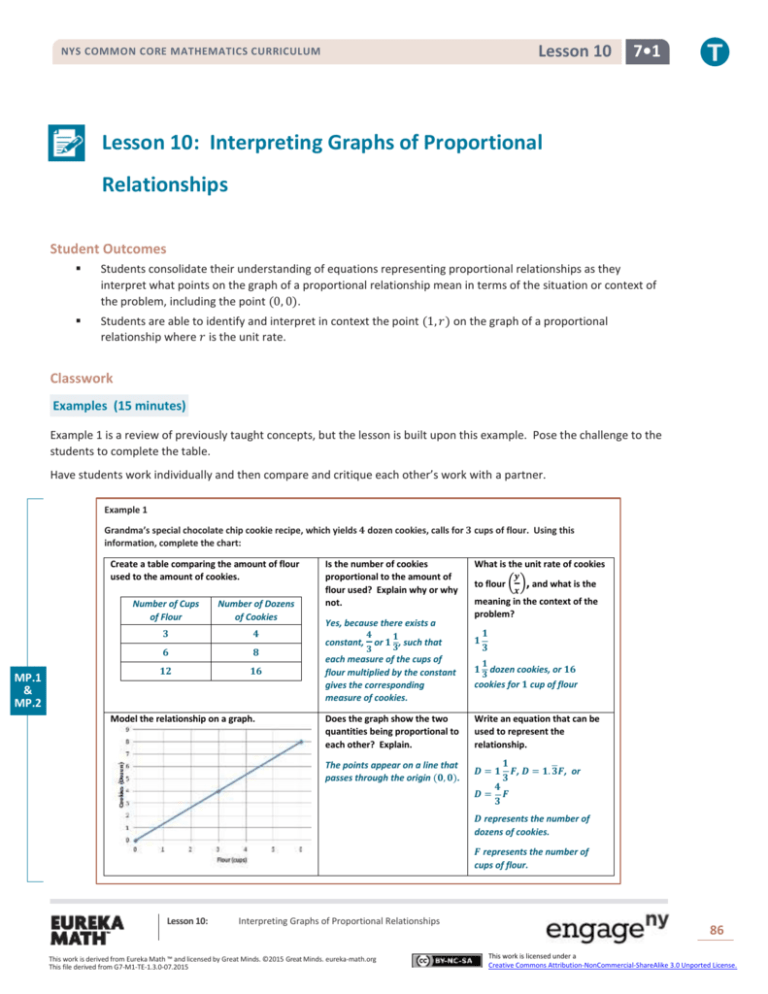
Lesson 10 NYS COMMON CORE MATHEMATICS CURRICULUM 7•1 Lesson 10: Interpreting Graphs of Proportional Relationships Student Outcomes Students consolidate their understanding of equations representing proportional relationships as they interpret what points on the graph of a proportional relationship mean in terms of the situation or context of the problem, including the point (0, 0). Students are able to identify and interpret in context the point (1, 𝑟) on the graph of a proportional relationship where 𝑟 is the unit rate. Classwork Examples (15 minutes) Example 1 is a review of previously taught concepts, but the lesson is built upon this example. Pose the challenge to the students to complete the table. Have students work individually and then compare and critique each other’s work with a partner. Example 1 Grandma’s special chocolate chip cookie recipe, which yields 𝟒 dozen cookies, calls for 𝟑 cups of flour. Using this information, complete the chart: Create a table comparing the amount of flour used to the amount of cookies. MP.1 & MP.2 Number of Cups of Flour Number of Dozens of Cookies 𝟑 𝟒 𝟔 𝟖 𝟏𝟐 𝟏𝟔 Model the relationship on a graph. Is the number of cookies proportional to the amount of flour used? Explain why or why not. Yes, because there exists a constant, 𝟒 𝟑 𝟏 𝟑 or 𝟏 , such that each measure of the cups of flour multiplied by the constant gives the corresponding measure of cookies. What is the unit rate of cookies 𝒚 to flour ( 𝒙 ), and what is the meaning in the context of the problem? 𝟏 𝟏 𝟑 𝟏 𝟑 𝟏 dozen cookies, or 𝟏𝟔 cookies for 𝟏 cup of flour Does the graph show the two quantities being proportional to each other? Explain. Write an equation that can be used to represent the relationship. The points appear on a line that passes through the origin (𝟎, 𝟎). 𝟏 ̅𝑭, or 𝑫 = 𝟏 𝑭, 𝑫 = 𝟏. 𝟑 𝟑 𝟒 𝑫= 𝑭 𝟑 𝑫 represents the number of dozens of cookies. 𝑭 represents the number of cups of flour. Lesson 10: Interpreting Graphs of Proportional Relationships This work is derived from Eureka Math ™ and licensed by Great Minds. ©2015 Great Minds. eureka-math.org This file derived from G7-M1-TE-1.3.0-07.2015 86 This work is licensed under a Creative Commons Attribution-NonCommercial-ShareAlike 3.0 Unported License. Lesson 10 NYS COMMON CORE MATHEMATICS CURRICULUM 7•1 Example 2 Below is a graph modeling the amount of sugar required to make Grandma’s special chocolate chip cookies. a. Record the coordinates from the graph. What do these ordered pairs represent? (𝟎, 𝟎); 𝟎 cups of sugar will result in 𝟎 dozen cookies. (𝟐, 𝟑); 𝟐 cups of sugar yield 𝟑 dozen cookies. (𝟒, 𝟔); 𝟒 cups of sugar yield 𝟔 dozen cookies. (𝟖, 𝟏𝟐); 𝟖 cups of sugar yield 𝟏𝟐 dozen cookies. (𝟏𝟐, 𝟏𝟖); 𝟏𝟐 cups of sugar yield 𝟏𝟖 dozen cookies. (𝟏𝟔, 𝟐𝟒); 𝟏𝟔 cups of sugar yield 𝟐𝟒 dozen cookies. b. Grandma has 𝟏 remaining cup of sugar. How many dozen cookies will she be able to make? Plot the point on the graph above. 𝟏. 𝟓 dozen cookies c. How many dozen cookies can Grandma make if she has no sugar? Can you graph this on the coordinate plane provided above? What do we call this point? (𝟎, 𝟎); 𝟎 cups of sugar will result in 𝟎 dozen cookies. The point is called the origin. Generate class discussion using the following questions to lead to the conclusion that the point (1, 𝑟) must be on the graph, and discuss what it means. 𝑦 𝐵 𝑥 𝐴 How is the unit rate of , or in this case , related to the graph? The unit rate must be the value of the 𝑦-coordinate of the point on the graph, which has an 𝑥coordinate of one. What quantity is measured along the horizontal axis? When you plot the ordered pair (𝐴, 𝐵), what does 𝐴 represent? The number of cups of sugar. The amount of sugar, in cups, that is needed to make 𝐵 dozen cookies. What quantity is measured along the vertical axis? The amount of cookies (number of dozens). Lesson 10: Interpreting Graphs of Proportional Relationships This work is derived from Eureka Math ™ and licensed by Great Minds. ©2015 Great Minds. eureka-math.org This file derived from G7-M1-TE-1.3.0-07.2015 87 This work is licensed under a Creative Commons Attribution-NonCommercial-ShareAlike 3.0 Unported License. Lesson 10 NYS COMMON CORE MATHEMATICS CURRICULUM 7•1 When you plot the point (𝐴, 𝐵), what does 𝐵 represent? The total amount of cookies, in dozens, that can be made with 𝐴 cups of sugar. What is the unit rate for this proportional relationship? Starting at the origin, if you move one unit along the horizontal axis, how far would you have to move vertically to reach the line you graphed? 1.5 1.5 units Continue moving one unit at a time along the horizontal axis. What distance, vertically, did you move? 1.5 units Why are we always moving 1.5 units vertically? The rate is 1.5 dozen/cup, that is, 1.5 dozen cookies for every 1 cup of sugar. The rate represents the proportional relationship 𝑦 = (1.5)𝑥, where the unit rate is 1.5. Thus, for any two points in the proportional relationship, if their 𝑥-values differ by 1 unit, then their 𝑦-values will differ by 1.5. Do you think the vertical move will always be equal to the rate when moving 1 unit horizontally whenever two quantities that are proportional are graphed? Yes, the vertical distance will always be equal to the unit rate when moving one unit horizontally on the axis. Exercises (20 minutes) Exercises 1. The graph below shows the amount of time a person can shower with a certain amount of water. a. Can you determine by looking at the graph whether the length of the shower is proportional to the number of gallons of water? Explain how you know. Yes, the quantities are proportional to each other since all points lie on a line that passes through the origin (𝟎, 𝟎). b. How long can a person shower with 𝟏𝟓 gallons of water? How long can a person shower with 𝟔𝟎 gallons of water? 𝟓 minutes; 𝟐𝟎 minutes c. What are the coordinates of point 𝑨? Describe point 𝑨 in the context of the problem. (𝟑𝟎, 𝟏𝟎). If there are 𝟑𝟎 gallons of water, then a person can shower for 𝟏𝟎 minutes. Lesson 10: Interpreting Graphs of Proportional Relationships This work is derived from Eureka Math ™ and licensed by Great Minds. ©2015 Great Minds. eureka-math.org This file derived from G7-M1-TE-1.3.0-07.2015 88 This work is licensed under a Creative Commons Attribution-NonCommercial-ShareAlike 3.0 Unported License. Lesson 10 NYS COMMON CORE MATHEMATICS CURRICULUM d. Can you use the graph to identify the unit rate? Since the graph is a line that passes through (𝟎, 𝟎) and (𝟏, 𝒓), you can take a point on 𝟏 the graph, such as (𝟏𝟓, 𝟓) and get . 𝟑 e. Write the equation to represent the relationship between the number of gallons of water used and the length of a shower. 𝟏 𝒎 = 𝒈, where 𝒎 represents the number of minutes, and 𝒈 represents the number 𝟑 of gallons of water. 2. 7•1 Scaffolding: Is it possible to switch the labels on the 𝑥-axis and on the 𝑦-axis? Can the gallons of water depend on the minutes? How would this change the problem? Your friend uses the equation 𝑪 = 𝟓𝟎𝑷 to find the total cost, 𝑪, for the number of people, 𝑷, entering a local amusement park. a. Create a table and record the cost of entering the amusement park for several different-sized groups of people. Number of People (𝑷) 𝟎 𝟏 𝟐 𝟑 b. Total Cost (in dollars, 𝑪) 𝟎 𝟓𝟎 𝟏𝟎𝟎 𝟏𝟓𝟎 Is the cost of admission proportional to the amount of people entering the amusement park? Explain why or why not. Yes. The cost of admission is proportional to the amount of people entering the amusement park because there exists a constant (𝟓𝟎), such that each measure of the amount of people multiplied by the constant gives the corresponding measures of cost. c. What is the unit rate, and what does it represent in the context of the situation? 𝟓𝟎; 𝟏 person costs $𝟓𝟎. d. Sketch a graph to represent this relationship. e. What points must be on the graph of the line if the two quantities represented are proportional to each other? Explain why, and describe these points in the context of the problem. (𝟎, 𝟎) and (𝟏, 𝟓𝟎). If 𝟎 people enter the park, then the cost would be $𝟎. If 𝟏 person enters the park, the cost would be $𝟓𝟎. For every 𝟏-unit increase along the horizontal axis, the change in the vertical distance is 𝟓𝟎 units. f. Would the point (𝟓, 𝟐𝟓𝟎) be on the graph? What does this point represent in the context of the situation? Yes, the point (𝟓, 𝟐𝟓𝟎) would be on the graph because 𝟓(𝟓𝟎) = 𝟐𝟓𝟎. The meaning is that it would cost a total of $𝟐𝟓𝟎 for 𝟓 people to enter the amusement park. Lesson 10: Interpreting Graphs of Proportional Relationships This work is derived from Eureka Math ™ and licensed by Great Minds. ©2015 Great Minds. eureka-math.org This file derived from G7-M1-TE-1.3.0-07.2015 89 This work is licensed under a Creative Commons Attribution-NonCommercial-ShareAlike 3.0 Unported License. Lesson 10 NYS COMMON CORE MATHEMATICS CURRICULUM 7•1 Closing (5 minutes) What points are always on the graph of two quantities that are proportional to each other? The points (0,0) and (1, 𝑟), where 𝑟 is the unit rate, are always on the graph. How can you use the unit rate of 𝑦 𝑥 to create a table, equation, or graph of a relationship of two quantities that are proportional to each other? In a table, you can multiply each 𝑥-value by the unit rate to obtain the corresponding 𝑦-value, or you can divide every 𝑦-value by the unit rate to obtain the corresponding 𝑥-value. You can use the equation 𝑦 𝑦 = 𝑘𝑥 and replace the 𝑘 with the unit rate of . In a graph, the points (1, 𝑟) and (0,0) must appear 𝑥 on the line of the proportional relationship. How can you identify the unit rate from a table, equation, or graph? From a table, you can divide each 𝑦-value by the corresponding 𝑥-value. If the ratio 𝑦: 𝑥 is equivalent 𝑦 for the entire table, then the value of the ratio, , is the unit rate, and the relationship is proportional. 𝑥 In an equation in the form 𝑦 = 𝑘𝑥, the unit rate is the number represented by the 𝑘. If a graph of a line passes through the origin and contains the point (1, 𝑟), 𝑟 representing the unit rate, then the relationship is proportional. How do you determine the meaning of any point on a graph that represents two quantities that are proportional to each other? Any point (𝐴, 𝐵) on a graph that represents a proportional relationship represents a number 𝐴 corresponding to the 𝑥-axis or horizontal unit, and 𝐵 corresponds to the 𝑦-axis or vertical unit. Lesson Summary The points (𝟎, 𝟎) and (𝟏, 𝒓), where 𝒓 is the unit rate, will always appear on the line representing two quantities that are proportional to each other. The unit rate, 𝒓, in the point (𝟏, 𝒓) represents the amount of vertical increase for every horizontal increase of 𝟏 unit on the graph. The point (𝟎, 𝟎) indicates that when there is zero amount of one quantity, there will also be zero amount of the second quantity. These two points may not always be given as part of the set of data for a given real-world or mathematical situation, but they will always appear on the line that passes through the given data points. Exit Ticket (5 minutes) Lesson 10: Interpreting Graphs of Proportional Relationships This work is derived from Eureka Math ™ and licensed by Great Minds. ©2015 Great Minds. eureka-math.org This file derived from G7-M1-TE-1.3.0-07.2015 90 This work is licensed under a Creative Commons Attribution-NonCommercial-ShareAlike 3.0 Unported License. NYS COMMON CORE MATHEMATICS CURRICULUM Name ___________________________________________________ Lesson 10 7•1 Date____________________ Lesson 10: Interpreting Graphs of Proportional Relationships Exit Ticket Great Rapids White Water Rafting Company rents rafts for $125 per hour. Explain why the point (0, 0) and (1, 125) are on the graph of the relationship and what these points mean in the context of the problem. Lesson 10: Interpreting Graphs of Proportional Relationships This work is derived from Eureka Math ™ and licensed by Great Minds. ©2015 Great Minds. eureka-math.org This file derived from G7-M1-TE-1.3.0-07.2015 91 This work is licensed under a Creative Commons Attribution-NonCommercial-ShareAlike 3.0 Unported License. Lesson 10 NYS COMMON CORE MATHEMATICS CURRICULUM 7•1 Exit Ticket Sample Solutions Great Rapids White Water Rafting Company rents rafts for $𝟏𝟐𝟓 per hour. Explain why the point (𝟎, 𝟎) and (𝟏, 𝟏𝟐𝟓) are on the graph of the relationship and what these points mean in the context of the problem. Every graph of a proportional relationship must include the points (𝟎, 𝟎) and (𝟏, 𝒓). The point (𝟎, 𝟎) is on the graph because 𝟎 can be multiplied by the constant to determine the corresponding value of 𝟎. The point (𝟏, 𝟏𝟐𝟓) is on the graph because 𝟏𝟐𝟓 is the unit rate. On the graph, for every 𝟏 unit change on the horizontal axis, the vertical axis will change by 𝟏𝟐𝟓 units. The point (𝟎, 𝟎) means 𝟎 hours of renting a raft would cost $𝟎, and (𝟏, 𝟏𝟐𝟓) means 𝟏 hour of renting the raft would cost $𝟏𝟐𝟓. Problem Set Sample Solutions 1. The graph to the right shows the relationship of the amount of time (in seconds) to the distance (in feet) run by a jaguar. a. What does the point (𝟓, 𝟐𝟗𝟎) represent in the context of the situation? In 𝟓 seconds, a jaguar can run 𝟐𝟗𝟎 feet. b. What does the point (𝟑, 𝟏𝟕𝟒) represent in the context of the situation? A jaguar can run 𝟏𝟕𝟒 feet in 𝟑 seconds. c. Is the distance run by the jaguar proportional to the time? Explain why or why not. Yes, the distance run by the jaguar is proportional to the time spent running because the graph shows a line that passes through the origin (𝟎, 𝟎). d. Write an equation to represent the distance run by the jaguar. Explain or model your reasoning. 𝒚 = 𝟓𝟖𝒙 𝒚 The constant of proportionality, or unit rate of , is 𝟓𝟖 and can be substituted into the equation 𝒚 = 𝒌𝒙 in 𝒙 place of 𝒌. 2. Championship t-shirts sell for $𝟐𝟐 each. a. What point(s) must be on the graph for the quantities to be proportional to each other? (𝟎, 𝟎), (𝟏, 𝟐𝟐) b. What does the ordered pair (𝟓, 𝟏𝟏𝟎) represent in the context of this problem? 𝟓 t-shirts will cost $𝟏𝟏𝟎. Lesson 10: Interpreting Graphs of Proportional Relationships This work is derived from Eureka Math ™ and licensed by Great Minds. ©2015 Great Minds. eureka-math.org This file derived from G7-M1-TE-1.3.0-07.2015 92 This work is licensed under a Creative Commons Attribution-NonCommercial-ShareAlike 3.0 Unported License. Lesson 10 NYS COMMON CORE MATHEMATICS CURRICULUM c. How many t-shirts were sold if you spent a total of $𝟖𝟖? 𝟒; 3. 7•1 𝟖𝟖 =𝟒 𝟐𝟐 The graph represents the total cost of renting a car. The cost of renting a car is a fixed amount each day, regardless of how many miles the car is driven. a. What does the ordered pair (𝟒, 𝟐𝟓𝟎) represent? It would cost $𝟐𝟓𝟎 to rent a car for 𝟒 days. b. What would be the cost to rent the car for a week? Explain or model your reasoning. Since the unit rate is 𝟔𝟐. 𝟓, the cost for a week would be 𝟔𝟐. 𝟓(𝟕) = $𝟒𝟑𝟕. 𝟓𝟎. 4. Jackie is making a snack mix for a party. She is using cashews and peanuts. The table below shows the relationship of the number of packages of cashews she needs to the number of cans of peanuts she needs to make the mix. Packages of Cashews 𝟎 𝟏 𝟐 𝟑 𝟒 a. Cans of Peanuts 𝟎 𝟐 𝟒 𝟔 𝟖 Write an equation to represent this relationship. 𝒚 = 𝟐𝒙, where 𝒙 represents the number of packages of cashews, and 𝒚 represents the number of cans of peanuts. b. Describe the ordered pair (𝟏𝟐, 𝟐𝟒) in the context of the problem. In the mixture, you will need 𝟏𝟐 packages of cashews and 𝟐𝟒 cans of peanuts. 5. The following table shows the amount of candy and price paid. Amount of Candy (in pounds) Cost (in dollars) a. 𝟐 𝟑 𝟓 𝟓 𝟕. 𝟓 𝟏𝟐. 𝟓 Is the cost of the candy proportional to the amount of candy? Yes, because there exists a constant, 𝟐. 𝟓, such that each measure of the amount of candy multiplied by the constant gives the corresponding measure of cost. b. Write an equation to illustrate the relationship between the amount of candy and the cost. 𝒚 = 𝟐. 𝟓𝒙 c. Using the equation, predict how much it will cost for 𝟏𝟐 pounds of candy. 𝟐. 𝟓(𝟏𝟐) = $𝟑𝟎 Lesson 10: Interpreting Graphs of Proportional Relationships This work is derived from Eureka Math ™ and licensed by Great Minds. ©2015 Great Minds. eureka-math.org This file derived from G7-M1-TE-1.3.0-07.2015 93 This work is licensed under a Creative Commons Attribution-NonCommercial-ShareAlike 3.0 Unported License. NYS COMMON CORE MATHEMATICS CURRICULUM d. 7•1 What is the maximum amount of candy you can buy with $𝟔𝟎? 𝟔𝟎 𝟐.𝟓 e. Lesson 10 = 𝟐𝟒 pounds Graph the relationship Lesson 10: Interpreting Graphs of Proportional Relationships This work is derived from Eureka Math ™ and licensed by Great Minds. ©2015 Great Minds. eureka-math.org This file derived from G7-M1-TE-1.3.0-07.2015 94 This work is licensed under a Creative Commons Attribution-NonCommercial-ShareAlike 3.0 Unported License.
