Country Water Resources Profile for Zambia
advertisement
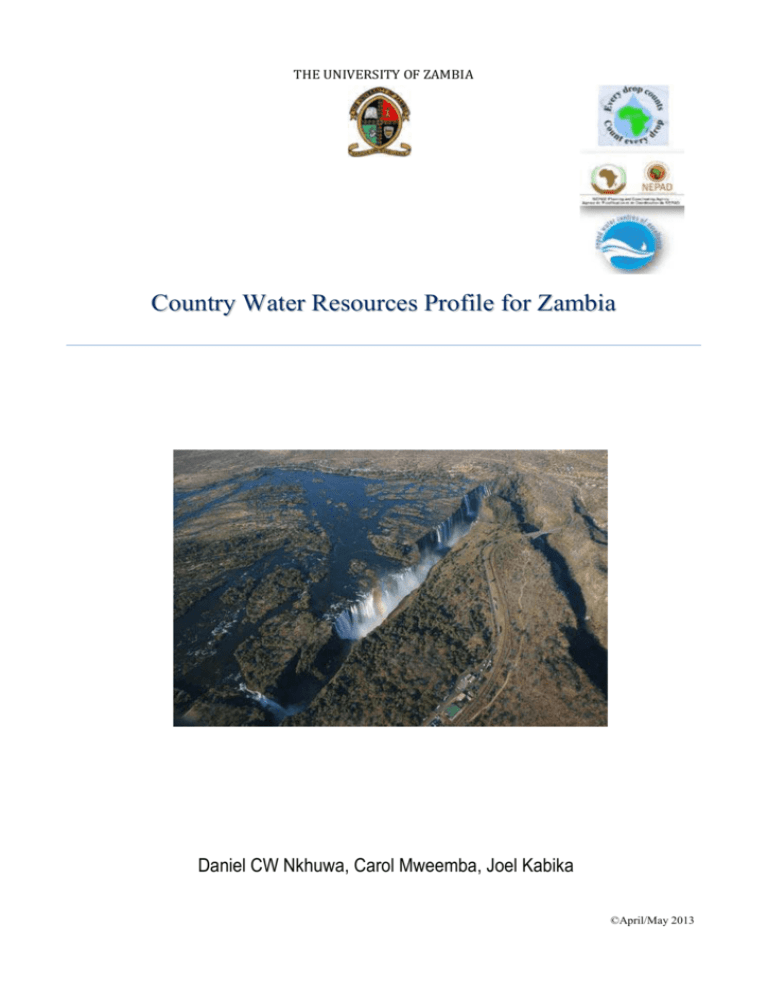
THE UNIVERSITY OF ZAMBIA Country Water Resources Profile for Zambia Daniel CW Nkhuwa, Carol Mweemba, Joel Kabika ©April/May 2013 Country Water Resources Profile for Zambia 1. INTRODUCTION Zambia lies on the Central African plateau at an altitude of between 1000 and 1600 above mean sea level (amsl). It has a moderately cool sub-tropical climate with three seasons, namely, (i) a cool dry season between April and August; (ii) a hot dry between August and November; and (iii) a hot wet season between November and April. 2. HYDROLOGY The country experiences an average mean annual rainfall of 1,020 mm. This ranges from about 700 mm, 910 – 1,300 mm and more than 1,300 mm in the southern, central and northern parts of the country, respectively (Figure 1A). Rainfall distribution in the country coincides roughly with the agro-ecological zones. Figure 1: (A) Mean annual rainfall distribution, and (B) Agro-ecological zones of Zambia 2.1. Surface water potential Rainfall variation from the south to north depicted in Figure 1A also makes river flows to experience seasonal variations withpeaks between March and April and the lowest flows being experienced between October and November. Generally, Zambia considers itself abundantly-endowed with water resources. The potential of its available surface water is relatively well understood and is contributed by Zambezi and Congo River Basins (Figure 2).The Zambezi Basin covers three-quarters of the country and comprises three sub-basins – Zambezi, Kafue and Luangwa. Figure 2: (A) the Zambezi and Congo River Basins, and (B) The Zambezi and Congo Basins’ sub-basins in Zambia(Source:http://www.eoearth.org/article/Zambezi_River?topic=78166& JICA-MEWD, 1995; respectively). Page 1 of 9 Country Water Resources Profile for Zambia The different sub-basins in the Zambezi and Congo Basins have different contributions to the country’s surface and groundwater resources. Table 1 shows their lengths in Zambia; their total areas (in Zambia and outside Zambia); their contribution each to surface water potential and their annual run-off. Table 1: Length, per cent contribution to surface water potential, and annual run-off within Zambia, and area (total, within and outside Zambia)of each Sub-Basin. (Source: JICA-MEWD, 1995) Basin area (km2) % contribution to Annual RunLength in Zambia Outside Sub-Basin (km) surface water potential off (km3) Total In Zambia Zambia Zambezi Kafue Luangwa Chambeshi Luapula Lake Tanganyika Total 1,700 1,300 850 560 615 250 5,272 687,049 156,995 147,622 44,427 173,396 249,000 268,235 156,995 144,358 44,427 113,323 15,856 418,814 3,264 60,073 233,144 36.36 8.40 19.44 7.62 26.25 1.73 41.75 9.88 22.32 8.75 30.14 1.99 1,458,489 743,194 715,295 99.8 114.83 In a high rainfall hydrological year, annual runoff can be as high as 130 Km3 per year, whileduring severe drought years, it can drop to as low as 68 Km3, in turn, affecting the amount of surface water. 2.2. Groundwater Potential, Main Aquifers and typical Yields Groundwater constitutes one major source of water supply in many parts of the country. It also sustains flows for many perennial rivers and streams during the dry season. The country’s aquifers are classified into three main types, namely, (i) aquifers, where groundwater flow is mainly through fissures/channels/discontinuities, which are classified as either highly or locally productive; (ii) aquifers, where intergranular groundwater flow is dominant, which occur mainly in alluvial soils; and (iii) Low yielding aquifers with limited potential (Figure 3). 3. WATER USE BY SECTOR Figure 3:Map of Zambia showing the three main types of aquifers Total water withdrawal in 2000 was (Source: National Water Resources Master Plan for Zambia, JICA1,737 * 106m3, with agricultural water MEWD, 1995). use accounting for 1,320 * 106 m3 (76 percent), or more than three-quarters of the total domestic water use claiming 286 * 106 m3, and dwindling industries taking 131 * 106 m3 (Table 2 and Figure 4). Table 2: Water use by sector. Source: FAO (2005). Figure 4: Water withdrawal (Total withdrawal: 1,737 * 106 m3 in 2000). Source: FAO (2005) Page 2 of 9 Country Water Resources Profile for Zambia 4. MAJOR WATER MANAGEMENT ISSUES Some of the major issues in water management in Zambia include: The uneven distribution of water resources across the country. High climatic variability (resulting in frequent floods and droughts) made worse by the emerging climate change phenomenon Degrading water quality is increasingly undermining the important role of water in the country’s economic development Water resources infrastructure is poorly developed or maintained (Figure 6). Growth in water demand, especially for agriculture and hydropower. Low access to safe and adequate water supply and sanitation. Country is wholly an international water course. No coordinated development in the water supply and sanitation sector. Figure 6: Poorly maintained water infrastructure. Rate of urbanization exceeds infrastructure (Source: Mulambo, 2011) development. Heightening growth in water demand, especially for agriculture and hydropower. ) High climatic variability resulting in frequent floods and droughts that are compounded by emerging the climate change phenomenon. Further, the Kafue River sub-basin, which supports about 45% of the country’s population, has been subjected to many different activities that benefit from its waters. These range from mining, commercial farming, hydropower generation, industrial storage sites, in-situ sanitation, farmyard drainage, wastewater lagoons, leaking sewers, etc. (Figure 6) that pose great risks of polluting both surface and ground water resources. From the foregoing, it can be observed that, driven by a continuous economic growth and a steady increase in population, the pressure of different sectors on water resources, particularly in the Kafue Basin, is rising. As such, Zambia faces several challenges in harnessing the potential of the actually abundant water resources in this very economically active sub-basin (Figure 6). 5. MAIN POLICY AND STRATEGY DOCUMENTS a) Revised National Water Policy of 2010, which provides, that: The Ministry of Mines, Energy and Water Development (MMEWD) is the lead institution in the water sector. Current institutional framework is fragmented and lacks capacity to effectively deal with water resources management issues. Page 3 of 9 Figure 6: (A) Socio-economic activities in the Kafue Basin. (B) Depiction of some typical activities in the basin’s major cities. Source (Top picture: Uhlendahl, et al., 2011; bottom picture: GWMatePublications. Country Water Resources Profile for Zambia b) Water Resources Management Act of 2011, whichprovides principles of water resources management, among them: That the environment is a water user and shall enjoy second priority of allocation and use to the human need. Efforts to create wealth shall be reflected in all decisions made in relation to the use of water The basic management unit shall be the catchment in recognition of the unity of the hydrological cycle There shall be no private ownership of water and no authorization for its use shall be in perpetuity. It is hoped that these will provide adequate legal (and institutional) framework for effective management, development and utilisation of the country’s water resources. 6. WATER SERVICES AND WATER RESOURCES a) The Urban areas are served by Commercial Utilities (CUs), Local Authorities (Las) and other providers. However, within the urban areas, only 47% receive services from CUs, while 43% are not served (Figure 7). Figure 7: (A) Water service provision in urban areas of Zambia, and (B) Levels of water service provision in urban areas of Zambia (Source: NWASCO, 2002/03 and 2011/12, respectively). Driven by continuous economic growth and steady increase in population, the pressure of different sectors on water resources, particularly in the urban centres of the Kafue Basin, is rising. Since the CUs cannot cope with demand for water supplies, most of the new structures being constructed at the moment have their own boreholes and septic tanks (Figure 8). Figure8: (A) Construction of houses in new settlements, and (B) Envisaged configuration of boreholes and septic tanks for each dwelling in Lusaka’s new low-density settlements. b) Rural areasaregenerally served by Local authorities. However, even where Local authorities provide water supply services, their provision has had a particularly poor record, with coverage levels actually declining. As such, most of these local authorities are again being displaced by CUs to provide these Page 4 of 9 Country Water Resources Profile for Zambia services to some of the typical rural areas in North-western, Western, Southern and Northern Provinces in an attempt to improve coverage and increase cost recovery (Figure 7). Recognizing this institutional weakness of most local authorities, Zambia is strengthening local capacity through the Rural Water Supply and Sanitation Unit (RWSSU). The Zambian government may require the implementation of a clearer cost recovery sharing policy with RWSS service providers in order to maintain rural service growth, especially with regard to sanitation coverage. However, the major challenge with water (and sanitation) provision to the country’s rural areas is the unclear institutional and legal frameworks responsible for these services. As projected in Figure 8, the institutions responsible for water supply and sanitation services appear quite clear for urban areas, but not for rural areas. Figure 8:Government institutions in the water sector(Source:Mulambo, 2011) Therefore, the recommendation for this scenario is for government to clarify the legal and institutional roles in water supply and sanitation services to rural areas of the country. 7. WATER RESOURCES R&D INSTITUTIONS In the coming decades, no natural resource may prove to be more critical to human health and well-being than water. Yet, even when there is abundant evidence that the condition of water resources in our country and many parts of the world is deteriorating, institutions responsible for managing these resources appear to have limited capacity to manage water-based habitats to maintain and improve species diversity and provide ecosystem services, while concurrently delivering human needs. Currently, intensifying competition for water resources byagricultural, industrial, and domestic usershas put a lot of pressure on water resources. Since the resource is least understood, solutions to avert these pressures have not been easy to formulate. In spite of having highly qualified staff in the country’s research and institutions of higher learning, they have remained unchallenged to provide solutions to such important issues of national development. In other words, research in our country has not been considered as an important tool for informed decision-making and policy formulation. Research in water and other water related fields are undertaken at the three public universities – University of Zambia, Copperbelt University and Mulungushi University – the National Institute for Industrial and Scientific Research, (NISIR) and the Natural Resources Development College (NRDC). However, research activities are marginal because of lack of funds put aside to support it. Even the marginal research that has undertaken, it has mainly been through projects. As such, the country has not had large scale basin- or catchment-wide research activities, which has resulted in a paucity of data at basin/catchment scale since project-driven projects have often targeted “hot spot” areas. Because of lack of support for research, there has been: a) A continuous programme to develop a pool of skilled water professionals in the country to augment those that have retired or have passed on. b) For those still undertakingwater research, no platform for research results’ dissemination to meaningfullycontribute to national development. c) As a result of (b), noincentive by policy-makers to use research results. Page 5 of 9 Country Water Resources Profile for Zambia d) As a result of all the above, no research policy direction for the country. Instead, research continues to be directed by individual initiative, drive and capacity. Consequently, research has remaineduntargeted and has not generated any motivation. Having identified that water scarcity and related insecurity are some of the sources of the continent’s underdevelopment and increasing economic decline, African leaders placedthe development, utilisation and management of water high on the NEPAD agenda. In the NEPAD framework, African leaders have committed themselves to “ensuring sustainable access to safe and adequate clean water supply and sanitation, especially for the poor” and “[to] plan / manage water resources to become a basis for national and regional cooperation and development.” Through this perspective, it is hoped that some of our countries will be compelled to look to research institutions to provide them with information that assists them to view the resource as such and give it the attention it deserves so that it can be managed sustainably for the benefit of its citizens now and in the future. 8. DOCUMENTED WATER SECTOR CAPACITY DEVELOPMENT NEEDS Zambia currently hosts only three public universities – University of Zambia, Copperbelt University and Mulungushi University – that offer water and water-related courses. Although the country also has a number of private universities, these generally concentrate on social sciences programmes. Further, the University of Zambia is the only institution that offers Masters and PhD programmes in water resources and water-related fields across mainly in the Schools of Mines (Department of Geology) and Engineering (Department of Civil and Environmental Engineering).Other Departments that offer water-related programmes include Geography, Chemistry and Biology (School of Natural Sciences) and Soil Science, Agricultural engineering and Crop Science (School of Agricultural Sciences) and Health science programmes in the School of Medicine. A good indication that government is beginning to give some attention to water issues was manifested in 2007, when it undertook a Sector Capacity Study for Water and Sanitation. The study identified staff gaps as shown in Table 3. Table 3: Annual Additional Staff Requirements (all converted to full-time positions). Source:GRZ/MLGH & Royal Danish Embassy, 2007 Sub-sector/areas Public sector/parastatal Rural water supply and sanitation (RWSS) Ministry of Local Government and Housing (MLGH)/ Department of Infrastructure and Support Services (DISS) Central: 5 MLGH Accountants Central:2-3 MLGH/DISS Regional: 8 Urban water supply and sanitation (UWSS) MLGH/ DISS Central: 1 DTF: 1 Water Resources Management (WRM) 1999/2003 scenario: 195-220 mainly provincial + district level officers 2005 scenarios: No staff increase, but more WRM planners etc. Water Quality Laboratories Upgrading of lab. facilities and staffing Research and Development UNZA WRM Centre: 5 NISIR/ WRRU: 5 RWSS Centre: 5 Page 6 of 9 District/Municipal Councils Commercial Utilities District Councils: 108 Municipal Councils : 10 More staff with degrees/diplomas If 25% of total staff = 136 Private Sector Consultants First 3yrs: 12-18; After 3yrs: 8-14 Drilling: 10-15 rigs with staff Borehole siting: 4-10 teams Drilling supervision: 10-15 supervisors Test pumping supervision: Some technicians Local well-diggers and masons: Significant number Consultants: 18 Contractors Skilled and unskilled labour Consultants: 8 Contractors Skilled & unskilled labour Upgrading of lab. facilities and staffing Upgrading of lab. facilities and staffing Country Water Resources Profile for Zambia In addition to skills gaps or additional staff required, as shown in Table 3, there was also a need to replace some of the staff that existed within the sector at the time because of retirement, resignations and illness/ death. In addition, another survey was undertaken in 2011/12 by Stellenbosch University– a node of the Southern African Network of Water Centres of Excellence (SANWATCE) – under the auspices of the EC-sponsored Joint Research Commission Project. This study comprised (NEPAD SANWATCE, 2012): JLP 1.1 – A survey on requirements in higher education and within training for practitioners in the water sector JLP 1.2 – A study on how the Water Centres of Excellence could better address sector expertise consultancy and advocacy needed for sector development in the region. The Zambian sector capacity report and water sector experts provided dome inputs, especially to the JLP 1.1. The JLP1.1 and JLP1.2survey concluded, among others, that: The majority of the skills were in higher education and research institutions. The survey excluded utilities, networking organisations, and water service providers that form a very important part of the water sector and should be included in any follow up survey. The knowledge base in the sector producing research outputs further indicated a major gap between South Africa and other SADC countries with research capacity. Major gaps in crucial areas e.g. water law, groundwater, eutrophication, energy, floods, erosion, infrastructure, sanitation, floods, and governance – thus reflecting major challenges in terms of water management. Many organizations support training provided within formal education structures such as Further Education Training; capacity building strategies; mentorships and Higher Education Training and support the different types of training being used. Further, there are at least Higher Educational Trainingprogrammes in each SADC country, but is unclear in which areas they specialise in, and should be investigated further in order to breach skills gaps and requirements In Zambia a total of 607 people were required in the following sectors: Rural Water Supply and Sanitation, Urban Water Supply and Sanitation, Water Research Management, Water Quality Laboratories and Research and Development. One of the recommendations from this study was that research driven capacity building should become a major focus of future investment in the SADC region in order to address the major backlog in terms of research output in the relevant priority areas for specific countries. These could be determined through consultation at a high governmental level and further be identified using more search criteria using software programmes like SciVal Spotlight and SciVal Expert. 9. CONCLUSION This summary of the country water resources profile CWRP hasobserved that intensifying competition for water resources by agricultural, industrial, and domestic users will continue to put a lot of pressure on water resources. The cause for this situation was identified as having been; (i) the country not being able to challenge its scientists to solve some water-related developmental issues, and (ii) research not receiving adequate attention, which has led to policy and decision-making remaining uninformed. Further, the report identified the following research and development gaps in the water sector, which must be addressed in order ‘to ensure that every Zambian has fair access to the resource and related services regardless of their economic and social status’. The report has also noted that there is inadequate research being undertaken in the country to: • Determine the impact of land use changes in areas of rapidly growing populations on the country’s surface- and ground-water resources. Page 7 of 9 Country Water Resources Profile for Zambia • Assess capacities of wastewater treatment plants in the country’s major cities (environmental audit of the treatment plants). • Assess the amount of available water resources in the country, especially groundwater. • Assess effects of climate change scenarios and drivers on the country’s surface water and groundwater resources. • Seek solutions to some existing societal challenges, including those that utilize indigenous knowledge. In this regard, the report concludes that for Zambia’s water to sustain lives and meet the socio-economic needs of the country’s citizens there is need to (i) support research activities in the acquisition of water data through continuous monitoring, (ii) analyse and assess data and information, and (iii) provide relevant feedback to decision makers and stakeholders. To attain these noble causes, the Government of the Republic of Zambia should recognise the importance of, and support research and research institutions with adequate resources and challenging them to provide solutions to some or most of the identified issues/challenges and gaps in the country’s water sector. 10. REFERENCES FAO, 2005: Irrigation in Africa in figures – AQUASTAT Survey. FAO Water Reports, pp609-620 Garduño, H., Foster, S., Dumars, C., Kemper, K., Tuinhof, A. and Nanni, M., 2006:Groundwater Quality Protection – Defining strategy and setting priorities. Sustainable Groundwater Management Concepts and Tools, Briefing Note Series Note 8, Groundwater Management Advisory Team (GW-MATE), 2002-2006, pp6 http://www.eoearth.org/article/Zambezi_River?topic=78166 GRZ/MLHG and Royal Danish Embassy (2007): Sector Capacity Study – Water and Sanitation. FinalReport. JICA-MEWD, 1995:The Study on the National Water Resources Master Plan in the Republic of Zambia. FinalReport – Main Report. Yachiyo Engineering Co. Ltd. NWASCO,2003: Urban and Peri-Urban Water Supply and Sanitation Sector Report 2002/03, Lusaka, Zambia, 32pp NWASCO,2012: Urban and Peri-Urban Water Supply and Sanitation Sector Report 2011/12, Lusaka, Zambia, 76pp Mulambo, C.,2011: National Urban Water Supply and Sanitation Programme (NURWSSP). Presentation made at the Zambia Water Forum and Exhibition (ZAWAFE),Golfiew Hotel, 7-8 November 2011, Lusaka, Zambia. NEPAD SANWATCE, 2012: Report on task JLP1.1 and JLP1.2, Deliverable 1a, EU JRCContract Number: 386793, Tender Number: IES/H/2011/01/02/NC Uhlendahl, T. Salian, P. Claudia Casarotto, C. and Doetsch, J., 2011: Good water governance and IWRM in Zambia: challenges and chances.Water Policy 13, pp845–862; IWA Publishing Page 8 of 9

