Online Figure 1: Title: Forest Plot of Pulse Pressure and
advertisement
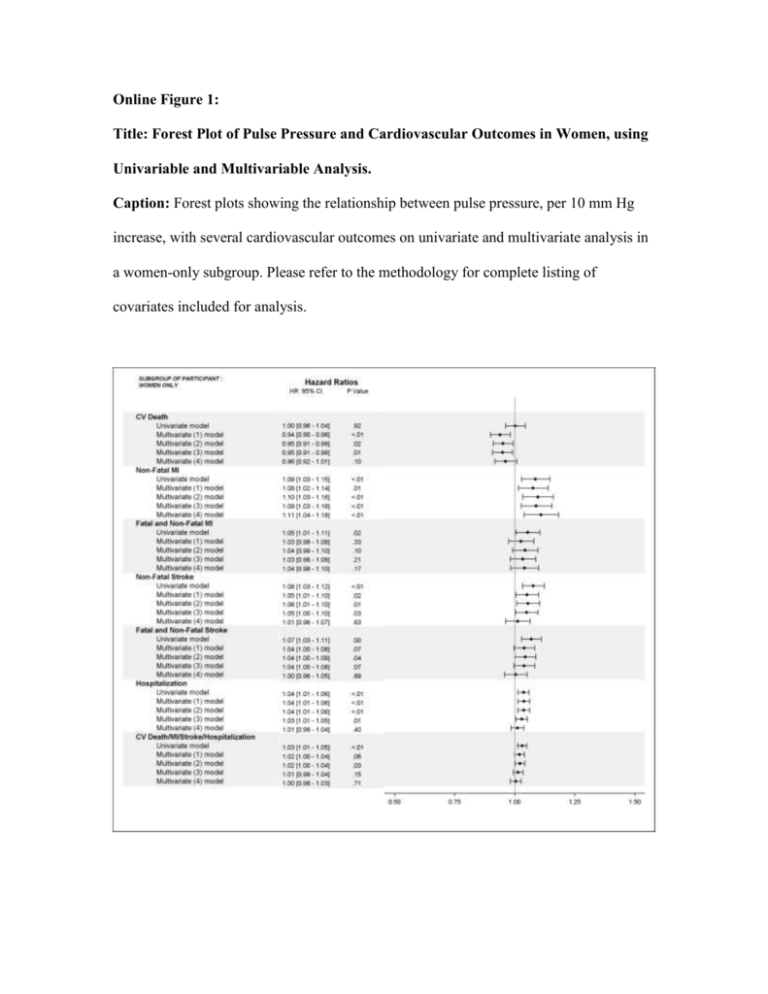
Online Figure 1: Title: Forest Plot of Pulse Pressure and Cardiovascular Outcomes in Women, using Univariable and Multivariable Analysis. Caption: Forest plots showing the relationship between pulse pressure, per 10 mm Hg increase, with several cardiovascular outcomes on univariate and multivariate analysis in a women-only subgroup. Please refer to the methodology for complete listing of covariates included for analysis. Online Figure 2: Title: Forest Plot of Pulse Pressure and Cardiovascular Outcomes in Participants at Least 60 Years Old, using Univariable and Multivariable Analysis. Caption: Forest plots showing the relationship between pulse pressure, per 10 mm Hg increase, with several cardiovascular outcomes on univariate and multivariate analysis in participants at least 60 years old. Please refer to the methodology for complete listing of covariates included for analysis. Online Figure 3: Title: Forest Plot of Pulse Pressure and Cardiovascular Outcomes in Participants without Established Atherothrombotic Disease, using Univariable and Multivariable Analysis. Caption: Forest plots showing the relationship between pulse pressure, per 10 mm Hg increase, with several cardiovascular outcomes on univariate and multivariate analysis in participants without established atherothrombotic disease. Please refer to the methodology for complete listing of covariates included for analysis. Online Figure 4: Title: Forest Plot of Pulse Pressure and Cardiovascular Outcomes in Participants with Systolic Blood Pressure ≤ 140 mmHg, using Univariable and Multivariable Analysis. Caption: Forest plots showing the relationship between pulse pressure, per 10 mm Hg increase, with several cardiovascular outcomes on univariate and multivariate analysis in participants with systolic blood pressure ≤ 140 mmHg. Please refer to the methodology for complete listing of covariates included for analysis. Online Figure 5: Title: Forest Plot of Pulse Pressure and Cardiovascular Outcomes in Participants with Systolic Blood Pressure > 140 mmHg, using Univariable and Multivariable Analysis. Caption: Forest plots showing the relationship between pulse pressure, per 10 mm Hg increase, with several cardiovascular outcomes on univariate and multivariate analysis in participants with systolic blood pressure > 140 mmHg. Please refer to the methodology for complete listing of covariates included for analysis. Online Figure 6: Title: Forest Plot of Pulse Pressure and Cardiovascular Outcomes in Participants not on Anti-hypertensive Treatment, using Univariable and Multivariable Analysis. Caption: Forest plots showing the relationship between pulse pressure, per 10 mm Hg increase, with several cardiovascular outcomes on univariate and multivariate analysis in participants not on anti-hypertensive treatment. Please refer to the methodology for complete listing of covariates included for analysis. Online Figure 7: Title: Forest Plot of Pulse Pressure and Cardiovascular Outcomes in Participants on Anti-hypertensive Treatment, using Univariable and Multivariable Analysis. Caption: Forest plots showing the relationship between pulse pressure, per 10 mm Hg increase, with several cardiovascular outcomes on univariate and multivariate analysis in participants on anti-hypertensive treatment. Please refer to the methodology for complete listing of covariates included for analysis. Online Table 1. Distribution of Pulse Pressure by Systolic Blood Pressure. Pulse Pressure* 1st Quart. 2nd Quart. 3rd Quart 4st Quart SBP < 140 mmHg 9754 (96.07%) 8856 (74.78%) 3883 (35.11%) 851 (7.07%) 140 mmHg ≤ SBP <160 mmHg 390 (3.84%) 2868 (24.22%) 6241 (56.42%) 5243 (43.58%) SBP ≥ 160 mmHg 9 (0.09%) 118 (1.00%) 937 (8.47%) 5937 (49.35%) *Percentages are given across each row of pulse pressure quartile. SBP, systolic blood pressure. Online Table 2. Association of Systolic Blood Pressure with Adverse Cardiovascular Events on Unadjusted and MultivariableAdjusted Analyses Outcome Event rate Unadjusted Multivariable-Adjusted* n/N, (%) HR 95% CI P-value HR 95% CI P-value Cardiovascular death Quartile 1 711/11068 (7.8%) — — — — — — Quartile 2 589/11407 (6.39%) 0.7 0.7, 0.8 <0.01 0.7 0.6, 0.8 <0.01 Quartile 3 725/12821 (6.84%) 0.8 0.7, 0.9 <0.01 0.8 0.7, 0.8 <0.01 Quartile 4 0.9 0.8, 1.0 0.24 0.8 0.7, 0.9 <0.01 604/9791 (7.4%) Non-fatal MI Quartile 1 330/11068 (3.73%) — — — — — — Quartile 2 311/11407 (3.38%) 0.8 0.7, 1.0 0.15 0.9 0.8, 1.0 0.51 Quartile 3 359/12821 (3.4%) 0.9 0.7, 1.0 0.28 0.9 0.8, 1.1 0.93 345/9791 (4.24%) 1.1 0.9, 1.3 0.05 1.2 1.0, 1.4 <0.01 Quartile 4 Fatal and non-fatal MI Quartile 1 486 /11068 (5.33%) — — — — — — Quartile 2 538 /11407 (5.65%) 0.8 0.7, 1.0 0.09 0.9 0.8, 1.0 0.21 Quartile 3 670 /12821 (6.27%) 0.9 0.8, 1.0 0.19 0.9 0.8, 1.0 0.43 Quartile 4 Non-fatal stroke 677 /9791(8.30%) 1.1 0.9, 1.2 0.10 1.1 0.9, 1.2 0.06 Quartile 1 389/11068 (4.34%) — — — — — — Quartile 2 450/11407 (4.8%) 1.1 0.9, 1.2 0.16 1.0 0.8, 1.1 0.79 582/12821 (5.48%) 1.2 1.1, 1.4 <0.01 1.1 0.9, 1.2 0.14 Quartile 4 Fatal and non-fatal stroke 576/9791 (7.12%) 1.6 1.4, 1.8 <0.01 1.4 1.2, 1.6 <0.01 Quartile 1 485/11068 (5.33%) — — — — — — Quartile 2 528 /11407 (5.65 %) 1.0 0.9, 1.1 0.56 0.9 0.8, 1.1 0.65 Quartile 3 660 /12821 (6.27 %) 1.1 1.0, 1.3 <0.01 1.0 0.9, 1.1 0.60 670 /9791 (8.30 %) 1.5 1.3, 1.7 <0.01 1.3 1.1, 1.5 <0.01 Quartile 3 Quartile 4 Hospitalization Quartile 1 2090/11068 (21.66%) — — — — — — Quartile 2 2135/11407 (21.17%) 0.9 0.9, 1.0 0.30 1.0 0.9, 1.0 0.71 Quartile 3 2511/12821 (22.26%) 1.0 0.9, 1.0 0.40 1.0 0.9, 1.1 0.12 Quartile 4 2238/9791 (25.76%) 1.2 1.1, 1.2 <0.01 1.2 1.1, 1.3 <0.01 CV Death/MI/Stroke/Hospitalization Quartile 1 2912/11068 (30.1%) — — — — — — Quartile 2 2869/11407 (28.58%) 0.9 0.8, 0.9 <0.01 0.9 0.9, 1.0 0.06 Quartile 3 3391/12821 (29.93%) 0.9 0.9, 1.0 0.60 0.9 0.9, 1.0 0.42 Quartile 4 2996/9791 (34.25%) 1.1 1.1, 1.2 <.01 1.1 1.0, 1.1 <0.01 * Multivariable model adjusted for sex; age; current smoking status; history of hypercholesterolemia, diabetes, or atherothrombosis; aspirin, statin, angiotensin converting enzyme inhibitor, angiotensin receptor blocker, beta-blocker, calcium channel blocker, or diuretic use. HR, hazard ratio; CI, confidence interval; CV, cardiovascular; MI, myocardial infarction Online Table 3. Association of Diastolic Blood Pressure with Adverse Cardiovascular Events on Unadjusted and Multivariable-Adjusted Analyses Outcome Event rate Unadjusted Multivariable-Adjusted* n/N, (%) HR 95% CI P-value HR 95% CI P-value Cardiovascular death Quartile 1 931/13173 (8.72%) — — — — — — Quartile 2 291/5934 (6.02%) 0.6 0.6, 0.7 <0.01 0.7 0.6, 0.9 <0.01 Quartile 3 838/15306 (6.65%) 0.7 0.6, 0.8 <0.01 0.8 0.8, 0.9 0.01 Quartile 4 569/10674 (6.3%) 0.7 0.6, 0.7 <0.01 0.8 0.8, 0.9 0.04 Non-fatal MI Quartile 1 442/13173 (4.18%) — — — — — — Quartile 2 149/5934 (3.17%) 0.7 0.6, 0.8 <0.01 0.7 0.6, 0.9 <0.01 Quartile 3 421/15306 (3.4%) 0.7 0.6, 0.9 <0.01 0.8 0.7, 0.9 0.02 Quartile 4 333/10674 (3.69%) 0.8 0.7, 1.0 0.11 0.9 0.8, 1.1 0.91 Fatal and non-fatal MI Quartile 1 642/13173 (5.95%) — — — — — — Quartile 2 258/5934 (5.32%) 0.7 0.6, 0.8 <0.01 0.7 0.6, 0.9 <0.01 Quartile 3 763/15306 (6.01%) 0.8 0.7, 0.9 <0.01 0.9 0.8, 1.0 0.23 Quartile 4 697/10674 (7.75%) 0.8 0.7, 0.9 0.01 0.9 0.8, 1.1 0.88 522/13173 (4.87%) — — — — — — Non-fatal stroke Quartile 1 Quartile 2 215/5934 (4.48%) 0.9 0.7, 1.0 0.23 0.8 0.7, 1.0 0.18 Quartile 3 658/15306 (5.21%) 1.0 0.9, 1.1 0.39 1.0 0.9, 1.1 0.31 Quartile 4 602/10674 (6.73%) 1.3 1.2, 1.5 <0.01 1.3 1.1, 1.4 <0.01 Fatal and non-fatal stroke Quartile 1 642/13173 (5.95%) — — — — — — Quartile 2 258/5934 (5.32%) 0.8 0.7, 1.0 0.09 0.8 0.7, 1.0 0.08 Quartile 3 763/15306 (6.01%) 0.9 0.8, 1.1 0.86 1.0 0.9, 1.1 0.58 697/10674 (7.75%) 1.3 1.1, 1.4 <0.01 1.2 1.1, 1.4 <0.01 Quartile 4 Hospitalization Quartile 1 2581/13173 (22.58%) — — — — — — Quartile 2 1057/5934 (20.42%) 0.8 0.8, 0.9 <0.01 0.9 0.8, 0.9 0.04 Quartile 3 2989/15306 (22.08%) 0.9 0.9, 1.0 0.17 0.9 0.9, 1.0 0.48 Quartile 4 2347/10674 (24.54%) 1.0 1.0, 1.1 <0.01 1.1 1.0, 1.1 <0.01 CV death/MI/Stroke/Hospitalization Quartile 1 3607/13173 (31.42%) — — — — — — Quartile 2 1420/5934 (27.52%) 0.8 0.8, 0.9 <0.01 0.8 0.8, 0.9 <0.01 Quartile 3 4052/15306 (29.92%) 0.9 0.8, 0.9 <0.01 0.9 0.9,1.0 0.15 Quartile 4 3089/10674 (32.13%) 1.0 0.9, 1.0 0.25 1.0 1.0, 1.1 0.01 * Multivariable model adjusted for sex; age; current smoking status; history of hypercholesterolemia, diabetes, or atherothrombosis; aspirin, statin, angiotensin converting enzyme inhibitor, angiotensin receptor blocker, beta-blocker, calcium channel blocker, or diuretic use. HR, hazard ratio; CI, confidence interval; CV, cardiovascular; MI, myocardial infarction.

