Handout
advertisement
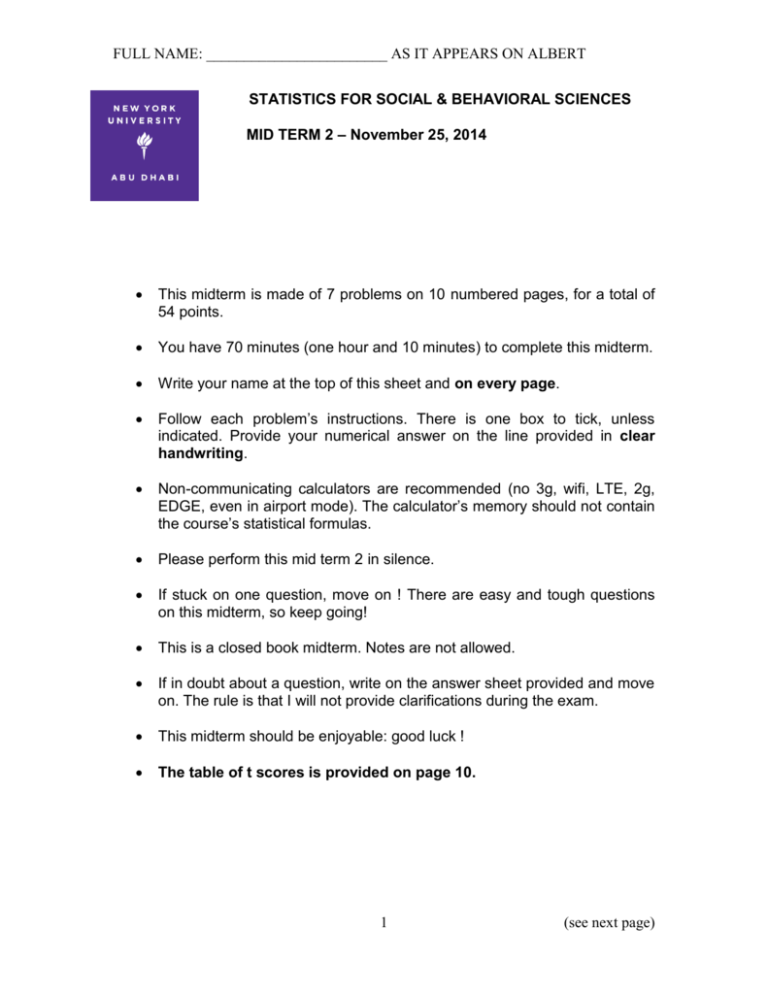
FULL NAME: ________________________ AS IT APPEARS ON ALBERT STATISTICS FOR SOCIAL & BEHAVIORAL SCIENCES MID TERM 2 – November 25, 2014 This midterm is made of 7 problems on 10 numbered pages, for a total of 54 points. You have 70 minutes (one hour and 10 minutes) to complete this midterm. Write your name at the top of this sheet and on every page. Follow each problem’s instructions. There is one box to tick, unless indicated. Provide your numerical answer on the line provided in clear handwriting. Non-communicating calculators are recommended (no 3g, wifi, LTE, 2g, EDGE, even in airport mode). The calculator’s memory should not contain the course’s statistical formulas. Please perform this mid term 2 in silence. If stuck on one question, move on ! There are easy and tough questions on this midterm, so keep going! This is a closed book midterm. Notes are not allowed. If in doubt about a question, write on the answer sheet provided and move on. The rule is that I will not provide clarifications during the exam. This midterm should be enjoyable: good luck ! The table of t scores is provided on page 10. 1 (see next page) FULL NAME: ________________________ AS IT APPEARS ON ALBERT Problem 1 – Sampling distribution of the t statistic (10 points) A researcher on Hepatitis B has a sample of 419,221 individuals, and he would like to test the null hypothesis that the average fraction of individuals with Hepatitis B is equal to 3%. In his sample, 2.8% of individuals have Hepatitis B. He takes a sheet a paper to remind himself of the sampling distribution of the t statistic. On the diagram below of the sampling distribution of the t statistic, draw/mark: ▪ the bell shaped sampling distribution of the t statistic ▪the label of the horizontal axis ▪the label of the vertical axis ▪the mean of the sampling distribution of the t statistic ▪the standard deviation of the sampling distribution t statistic (mark a segment) ▪the t score (and minus the t score) for confidence levels 90%, 95%, 99%. ▪the fraction of t statistics that are above the t score at 95% confidence level. ▪ the fraction of t statistics that are below minus the t score at 95% confidence level. The sampling distribution of the t statistic: is right skewed is symmetric is left skewed none of the above 2 (see next page) FULL NAME: ________________________ AS IT APPEARS ON ALBERT Problem 2 – True or False? (6 points) An NYU Abu Dhabi student did not take “statistics for social sciences” but read the book independently. He tends to make some mistakes. What assertions are true? Tick the only answer that applies. 1. For a test at 95% confidence that the population mean is equal to 0.4, the probability of Type II error is 5%. True. False, the probability of Type II error is 95%. False, the probability of Type II error is unknown. 2. As sample size increases, for a test at given significance level, the probability of Type I error decreases. True. False, the probability of Type I error increases, as the standard error decreases. False, the probability of Type I error is constant. 3. For a t test, the null hypothesis is that the sample mean is equal to a given value (say 0.5) True False, the null hypothesis is that the population mean is equal to a given value. False, the null hypothesis is that the population mean is different from a given value. False, the null hypothesis is that the sample mean is different from a given value. 4. For a large sample size, the standard deviation of the sampling distribution of the t statistic is 1 True 3 (see next page) FULL NAME: ________________________ AS IT APPEARS ON ALBERT False, the standard deviation of the sampling distribution of the t statistic is 1.96. False, the standard deviation of the sampling distribution of the t statistic is 2 times 1.96. 5. As the confidence level increases, the confidence interval for the sample mean gets larger. True False 6. The standard error of a sample mean of X is always smaller or equal than the standard deviation of the variable X. True. False, it depends on the sample. False, is always larger. 7. The sampling distribution of the t statistic has thinner tails than the normal distribution. In other words, the probability of extremely large values of the t statistic is smaller in the t distribution than in the normal distribution. True False 8. The larger the number of degrees of freedom of a t distribution, the smaller the t score at 95%. True False, the larger the t score. False, it depends on the standard deviation of the sample. Problem 3 – Ancient manuscript (6 points) You discovered an old statistics manuscript written in 1966. The author (John Enroe) said that he collected a sample by simple random sampling in the population of Gaborone residents, with a variable “age” for each individual of the sample. 4 (see next page) FULL NAME: ________________________ AS IT APPEARS ON ALBERT John Enroe in the manuscript says that he can reject the null hypothesis that the population mean age is equal to 30 years old at 95%, but not at 99%. In his sample, the average age was 27 years old, and the number of observations in the sample was N=341. The original data has been lost, and the manuscript was typed on an old typewriter. We would like to recover the standard deviation of age in Gaborone. Write down the formula for the Margin of Error as a function of the sample size N, the standard deviation of age, and the z statistic. ________________________________________________________________ The manuscript says that the null hypothesis is rejected at 95%, therefore: The standard deviation in the sample is smaller than The manuscript says that the null hypothesis is not rejected at 99%. Thus the standard deviation in the sample is larger than ________________________________________________________________ Problem 4 – Bayesian doctor (9 points) A doctor in South African has read in a study that out of 300 patients whose medical condition had improved, 100 had taken MedPlus, while 200 patients had not taken MedPlus. Out of 200 patients whose condition had not improved, 100 had taken Medplus, while 100 had not taken Medplus. The overall proportion of patients whose condition has improved is 60%. The doctor is ultimately interested in the probability that a patient improves conditional on having taken Medplus. 1. Write down Rule #3 of probabilities for two events that are not independent: 5 (see next page) FULL NAME: ________________________ AS IT APPEARS ON ALBERT 2. Can you qualify the event A : “Patient taking Medplus” and the event B : “Patient improving”? Tick only the boxes that apply: A and B are unrelated A and B are overlapping A and B are mutually exclusive A and B are independent A and B are related 3. What is the probability that a patient improves conditional on having taken Medplus? Problem 5 – Textual analysis (12 points) In a library, an old series of speeches of a US president are unattributed – the actual president who wrote those speeches is unknown. A political scientist, Alfred Moolb, would like to find out who wrote those speeches. In totality, those speeches have 4,000 words, and he uses the following words with the following frequency Word until whereas task bravery Frequency 7% 3% 5% 0.5% We suspect that the speeches have been authored by John Fitzgerald Kennedy. We collect the writings of John Fitzgerald Kennedy, and find he uses these words with the following frequency: Word until whereas task bravery Frequency 6% 3.4% 4% 1% We would like to test the null hypothesis that ‘the fraction of uses of the word “until” in the unknown president’s speeches is equal to the fraction of uses of the word “until” for John Fitzgerald Kennedy.’ The fraction of uses of the word “until” for John Fitzgerald Kennedy is exactly known. 6 (see next page) FULL NAME: ________________________ AS IT APPEARS ON ALBERT 1. Give a 99% confidence interval for the fraction of uses of the word “until” in the unknown president’s speeches: [ , ] 2. Give the t statistic for the null hypothesis: 3. At what significance levels can we reject the null hypothesis? Tick all that apply (points added for right answer, removed for wrong answer). None At 1% At 5% At 10% 4. Now the political scientist Alfred Moolb builds a t statistic for many null hypothesis. Each null hypothesis is ‘the fraction of uses of the word “XXXXX” in the unknown president’s speeches is equal to the fraction of uses of the word “XXXXX” in John Fitzgerald Kennedy’s speeches’. He writes the null hypothesis for 500 different words XXXXX, including until, whereas, task, bravery, and 496 other words. He builds a t statistic for each word as well. Under the null hypothesis, how many of the 500 t statistics will be strictly greater than 2.58 (t>2.58)? Under the null hypothesis, how many of the 500 t statistics will be strictly lower than -2.58 (t<-2.58)? Under the null hypothesis, how many of the 500 t statistics will be strictly lower than -1.65 (t<-1.65)? 7 (see next page) FULL NAME: ________________________ AS IT APPEARS ON ALBERT Problem 6 – Pakistan Travel (5 points) Anthony is a research assistant for the Clinton Foundation in Pakistan. He has collected observations on samples in different cities. In each city, he tests a null hypothesis for the mean of a variable. The variable has a normal distribution. Each line of this table corresponds to a separate sample of size N, and a separate null hypothesis. Tick all boxes that apply in the last three columns. Sample Lahore Islamabad Sukkur Larkana Peshawar Hyderabad Karachi t statistic 3.2 -1.02 4.5 -6.4 -7.8 2.1 -2.5 sample size N 23 11 2 2 120 31 29 Reject H0 at 90% ? 8 Reject H0 at 95% ? Reject H0 at 99% ? (see next page) FULL NAME: ________________________ AS IT APPEARS ON ALBERT Problem 7 – Correlation and Slope The World Bank argues that a higher fraction of women with a college degree causes a lower rate of violence. They found that the average fraction of women with a college degree across countries is 25%. They also found that the standard deviation of violent acts is 10. In the same report, the correlation between the fraction of women with a college degree and violent acts is -0.4. Give the formula relating slope and correlation. What is the slope of the relationship between the fraction of women with a college degree (explanatory variable) and violence (dependent variable)? ________________________________________________________________ Thus… he higher the fraction of women with a college degree, the higher the number of violent acts in a country. he higher the fraction of women with a college degree, the lower the number of violent acts in a country. … A 1 percentage point increase in the fraction of women with a college degree leads to a ……….. (increase/decrease) in the number of violent acts. 9 (see next page) FULL NAME: ________________________ AS IT APPEARS ON ALBERT Table of t Scores END OF MIDTERM Thank you for your answers. 10 (see next page) FULL NAME: ________________________ AS IT APPEARS ON ALBERT DRAFT – WRITE HERE – ONLY ANSWERS ON THE ANSWER FORM ITSELF WILL BE CONSIDERED (FIRST 9 PAGES) 11 (see next page) FULL NAME: ________________________ AS IT APPEARS ON ALBERT DRAFT – WRITE HERE – ONLY ANSWERS ON THE ANSWER FORM ITSELF WILL BE CONSIDERED (FIRST 9 PAGES) 12 (see next page) FULL NAME: ________________________ AS IT APPEARS ON ALBERT DRAFT – WRITE HERE – ONLY ANSWERS ON THE ANSWER FORM ITSELF WILL BE CONSIDERED (FIRST 9 PAGES) 13 (see next page)

