Mar Dionysius Senior Sec. School Rishi Valley, Mallappally, Kerala
advertisement

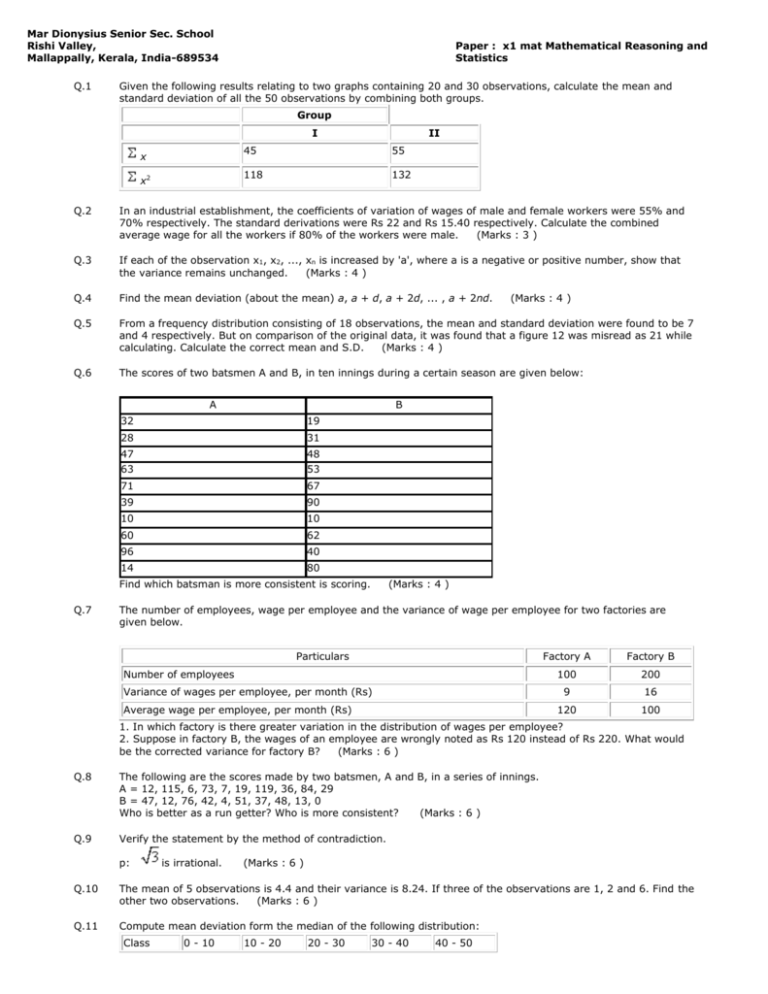
Mar Dionysius Senior Sec. School Rishi Valley, Mallappally, Kerala, India-689534 Q.1 Paper : x1 mat Mathematical Reasoning and Statistics Given the following results relating to two graphs containing 20 and 30 observations, calculate the mean and standard deviation of all the 50 observations by combining both groups. Group I x x2 II 45 55 118 132 Q.2 In an industrial establishment, the coefficients of variation of wages of male and female workers were 55% and 70% respectively. The standard derivations were Rs 22 and Rs 15.40 respectively. Calculate the combined average wage for all the workers if 80% of the workers were male. (Marks : 3 ) Q.3 If each of the observation x1, x2, ..., xn is increased by 'a', where a is a negative or positive number, show that the variance remains unchanged. (Marks : 4 ) Q.4 Find the mean deviation (about the mean) a, a + d, a + 2d, ... , a + 2nd. Q.5 From a frequency distribution consisting of 18 observations, the mean and standard deviation were found to be 7 and 4 respectively. But on comparison of the original data, it was found that a figure 12 was misread as 21 while calculating. Calculate the correct mean and S.D. (Marks : 4 ) Q.6 The scores of two batsmen A and B, in ten innings during a certain season are given below: A B 32 19 28 31 47 48 63 53 71 67 39 90 10 10 60 62 96 40 14 80 Find which batsman is more consistent is scoring. Q.7 (Marks : 4 ) (Marks : 4 ) The number of employees, wage per employee and the variance of wage per employee for two factories are given below. Particulars Number of employees Variance of wages per employee, per month (Rs) Average wage per employee, per month (Rs) Factory A Factory B 100 200 9 16 120 100 1. In which factory is there greater variation in the distribution of wages per employee? 2. Suppose in factory B, the wages of an employee are wrongly noted as Rs 120 instead of Rs 220. What would be the corrected variance for factory B? (Marks : 6 ) Q.8 The following are the scores made by two batsmen, A and B, in a series of innings. A = 12, 115, 6, 73, 7, 19, 119, 36, 84, 29 B = 47, 12, 76, 42, 4, 51, 37, 48, 13, 0 Who is better as a run getter? Who is more consistent? (Marks : 6 ) Q.9 Verify the statement by the method of contradiction. p: is irrational. (Marks : 6 ) Q.10 The mean of 5 observations is 4.4 and their variance is 8.24. If three of the observations are 1, 2 and 6. Find the other two observations. (Marks : 6 ) Q.11 Compute mean deviation form the median of the following distribution: Class 0 - 10 10 - 20 20 - 30 30 - 40 40 - 50 Frequency 5 Q.12 Q.13 10 20 5 10 The following frequency distributions have been constructed from measurements of heights weights (in lks) of the same group of adults. Which is more variable, height or weight? Mid point (height) Frequency Mid point (weight) 60 10 84 62 10 94 64 30 104 66 30 114 68 15 124 70 5 134 144 100 154 (in inches) and Frequency 10 10 15 20 15 10 10 10 100 The mean of 5 observations is 4.4 and the variance is 8.24. If three observations are 1, 2, 6, find the other two observations. (Marks : 6 )


