Quinnsupps
advertisement
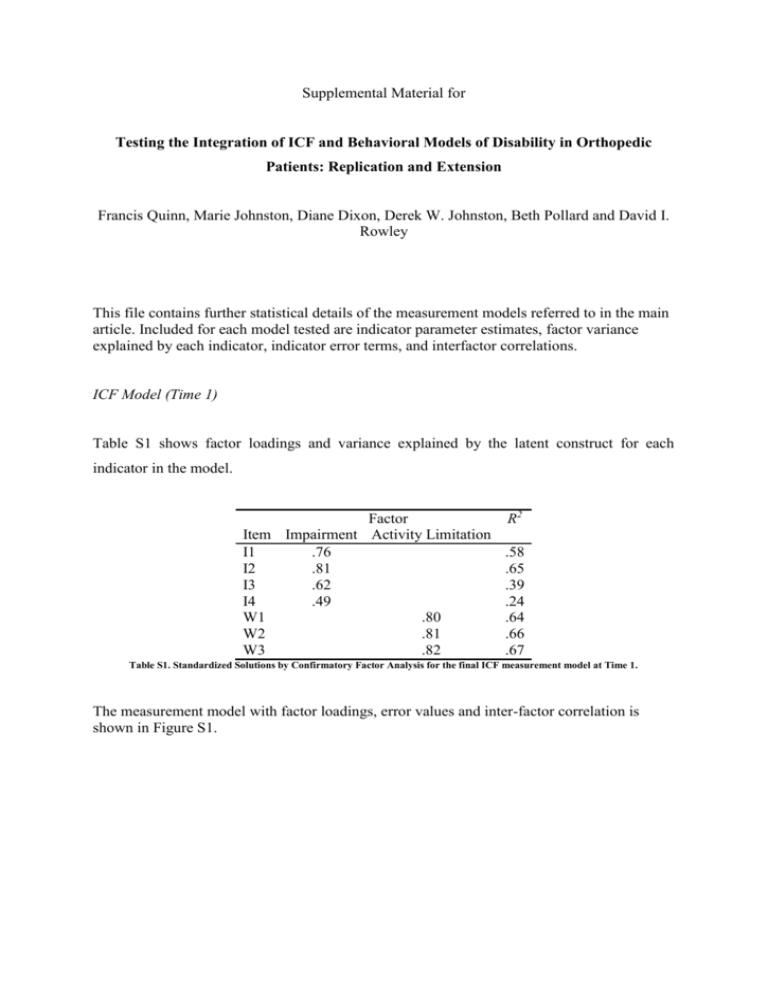
Supplemental Material for Testing the Integration of ICF and Behavioral Models of Disability in Orthopedic Patients: Replication and Extension Francis Quinn, Marie Johnston, Diane Dixon, Derek W. Johnston, Beth Pollard and David I. Rowley This file contains further statistical details of the measurement models referred to in the main article. Included for each model tested are indicator parameter estimates, factor variance explained by each indicator, indicator error terms, and interfactor correlations. ICF Model (Time 1) Table S1 shows factor loadings and variance explained by the latent construct for each indicator in the model. Factor Item Impairment Activity Limitation I1 .76 I2 .81 I3 .62 I4 .49 W1 .80 W2 .81 W3 .82 R2 .58 .65 .39 .24 .64 .66 .67 Table S1. Standardized Solutions by Confirmatory Factor Analysis for the final ICF measurement model at Time 1. The measurement model with factor loadings, error values and inter-factor correlation is shown in Figure S1. .65 I1 .59 I2 .76 .81 .62 .79 I3 .87 I4 Impairment .49 .59* .58 W1 .80 .81 .57 Activity Limitation W2 .82 .56 W3 Figure S1. CFA results for ICF model at Time 1 showing standardized coefficients. TPB Model (Time 1) Table S2 below shows factor loadings and variance explained for each indicator in the model. Item Intention INT1 .97 INT3 .81 PBC3 PBC4 PBC5 PBC6 W1 W2 W3 Factor PBC Activity Limitation .81 .89 .92 .77 .87 .79 .77 R2 .94 .65 .66 .79 .84 .60 .75 .62 .59 Table S2. Standardized Solutions by Confirmatory Factor Analysis for the TPB measurement model at Time 1. The measurement model including interfactor correlations is shown in Figure S2. -.64* .87* -.70* Intention .97 Activity Limitation PBC .81 .81 INT1 PBC 3 INT3 .77 .89 PBC 4 .59 W1 PBC 5 .58 .24 PBC 6 .92 .87 .77 .79 W3 W2 .63 .45 .40 .50 .62 .64 Figure S2. CFA of TPB measurement model at Time 1 showing standardized coefficients and interfactor correlations. Integrated model (Time 1) As indicators, factor loadings and error terms are identical to the non-integrated models, these are not shown and can be found above. Interfactor correlations are shown in Figure S3. .59* -.45* -.41* Impairment -.64* .87* Intention -.70* PBC Activity Limitation Figure S3. CFA model for ICF/TPB model at Time 1, with inter-factor correlations shown. ICF Model (Time 2) Table S4 shows factor loadings and variance explained for each indicator in the model. Factor Item Impairment Activity Limitation I1 .64 I2 .76 I3 .80 I4 .59 W1 .76 W2 .87 W3 .94 R2 .41 .57 .63 .35 .57 .75 .88 Table S4. Standardized Solutions by Confirmatory Factor Analysis for the ICF measurement model at Time 2. The measurement model with factor loadings, error values and inter-factor correlation is shown in Figure S4. .77 I1 .65 I2 .64 .76 .80 .61 I3 .81 I4 Impairment .59 .72* .65 W1 .76 .87 .50 Activity Limitation W2 .94 .35 W3 Figure S4. CFA results for ICF model at Time 2 showing standardized coefficients and interfactor correlation. TPB model (Time 2) Table S5 shows factor loadings and variance explained for each indicator in the measurement model, while Figure S5 shows standardized coefficients, error terms, and interfactor correlations. R2 Factor PBC Activity Limitation Item Intention INT1 .96 INT3 .95 PBC3 PBC4 PBC5 PBC6 W1 W2 W3 .93 .91 .70 .85 .86 .66 .62 .77 .81 .84 .92 .93 .81 .78 .88 .91 Table S5. Standardized Solutions by Confirmatory Factor Analysis for the TPB measurement model at Time 2. -.79* .92* -.83* Intention .97 .84 .95 PBC3 INT1 Activity Limitation PBC INT3 .81 .92 PBC4 .93 .79 .91 PBC6 W1 PBC5 .88 W3 W2 .55 .27 .31 .59 .39 .38 .62 .47 .41 Figure S5. CFA of TPB model at Time 2 showing standardized coefficients and interfactor correlations. Integrated model (Time 2) As indicators, factor loadings and error terms are identical to the non-integrated models, these are not shown and can be found above. Interfactor correlations are shown in Figure S6. .72* -.49* -.43* Impairment -.78* .92* Intention -.82* PBC Activity Limitation Figure S6. Measurement model for ICF/TPB model at Time 2, with inter-factor correlations shown. Note. Indicators, factor loadings and error terms not shown. These data are identical to the non-integrated models and can be found above.
