Name Date_________________ Advanced Math K Extra
advertisement
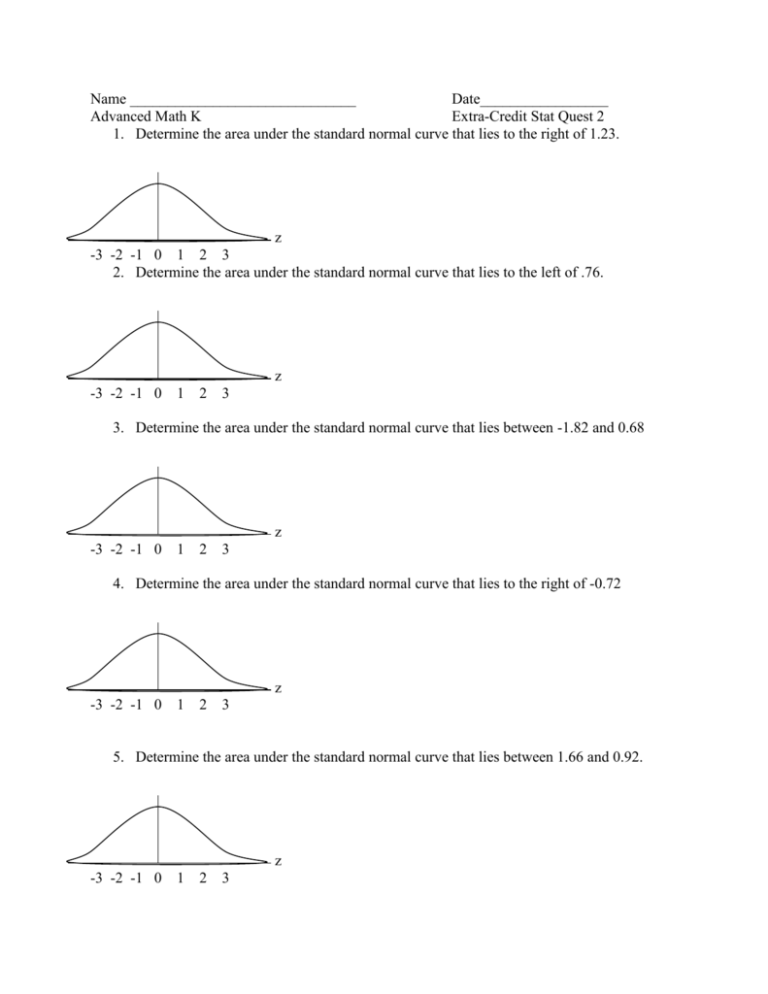
Name ______________________________ Date_________________ Advanced Math K Extra-Credit Stat Quest 2 1. Determine the area under the standard normal curve that lies to the right of 1.23. z -3 -2 -1 0 1 2 3 2. Determine the area under the standard normal curve that lies to the left of .76. z -3 -2 -1 0 1 2 3 3. Determine the area under the standard normal curve that lies between -1.82 and 0.68 z -3 -2 -1 0 1 2 3 4. Determine the area under the standard normal curve that lies to the right of -0.72 z -3 -2 -1 0 1 2 3 5. Determine the area under the standard normal curve that lies between 1.66 and 0.92. z -3 -2 -1 0 1 2 3 On a standardized test, scores are normally distributed with mean 50 and standard deviation 10. What percentage of scores are: 6. less than 55 z_____________________ -3 -2 -1 0 1 2 3 7. greater than 42 z ____________________ -3 -2 -1 0 1 2 3 8. between 56 and 66 z _____________________ -3 -2 -1 0 1 2 3 In a poll of 100 randomly selected voters, 36 said they preferred Candidate B___ 9. Compute p _____________ 10. and the standard deviation s = p (1 – p) ___________ n 11. Give a 95% confidence interval for p, the proportion of the entire voting population preferring Candidate B. p – 2s < p < p + 2s ___________________________ 12. Give a 99% confidence interval for p, the proportion of the entire voting population preferring Candidate B. p – 3s < p < p + 3s Most of us have heard that more intelligent people do better in school, but is this always true? Experienced teachers often know that this is only partially true. The following data represents the correlation between students’ IQ and their cumulative grade averages CGA IQ (x) 117 CGA (y)3.7 92 2.6 102 3.3 115 2.2 87 2.4 76 1.8 107 2.8 108 3.2 121 3.8 91 3 113 4 98 3.5 13. Draw a scatter plot of the data, labeling axes appropriately. 14. 15. Find r (round to 3 decimal places) _______ _ Find y (round to 3 decimal places)_______ 16. Find the regression equation (round each number to 3 decimal places y1 = ____________ 17. At the 95% confidence level, predict the CGA of a student has an IC of 130 __________ 18. At the 99% confidence level, predict the CGA of a student with an IQ of 80 __________ In each case, state whether you would have a positive correlation, a negative correlation, or no correlation. Explain your reasoning. (These problems will be like p668 (1-8))

