outline, all topics
advertisement
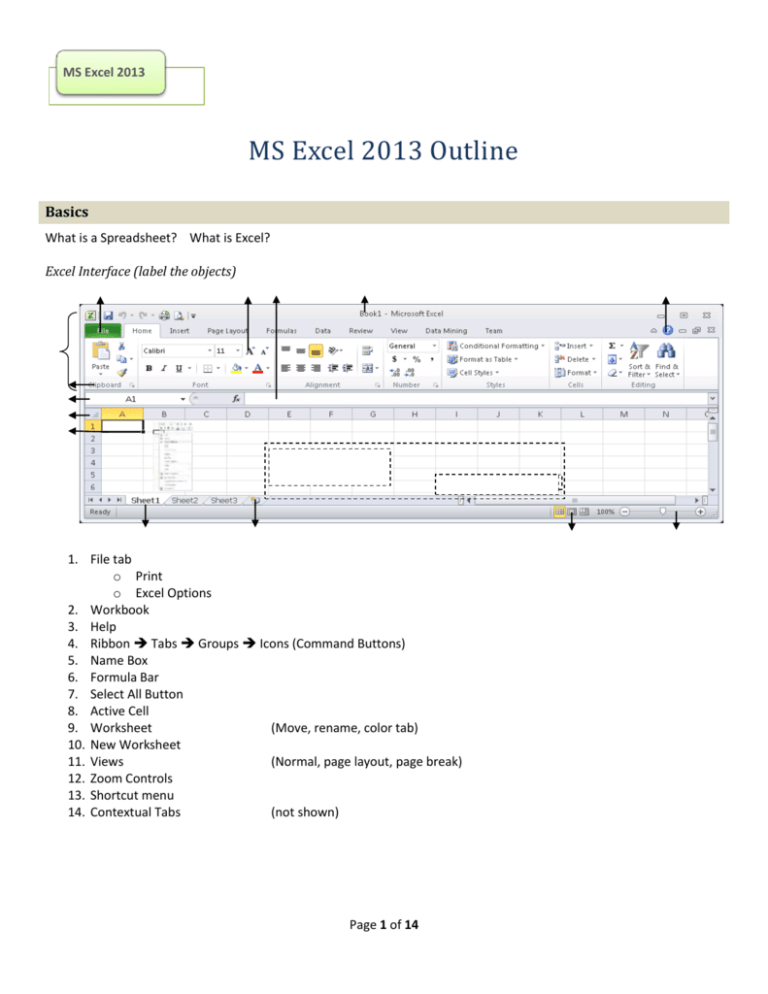
MS Excel 2013 MS Excel 2013 Outline Basics What is a Spreadsheet? What is Excel? Excel Interface (label the objects) 1. File tab o Print o Excel Options 2. Workbook 3. Help 4. Ribbon Tabs Groups Icons (Command Buttons) 5. Name Box 6. Formula Bar 7. Select All Button 8. Active Cell 9. Worksheet (Move, rename, color tab) 10. New Worksheet 11. Views (Normal, page layout, page break) 12. Zoom Controls 13. Shortcut menu 14. Contextual Tabs (not shown) Page 1 of 14 MS Excel 2013 Example 1 (“Intro” worksheet) Spreadsheet Components Cell Active Cell Cell Referencing Cell Range o Adjacent o Non-adjacent o Moving Columns/Rows o Adjusting Manually Double-Click Specifically o Hiding o Adding / Deleting Cell Contents (4 types) number text date formula (and formula view) Other features Named Range Right-Clicking Cell size too small Example 2 (“AutoFill” worksheet) Copy & Paste options AutoFill Using the Fill Handle o Drag/Drop o Copy+Double-click to fill all the way to end of column (must have info in at least one column) Numbers, Text, Ordinal Positions Dates, Months, Days of Week Printing Worksheet Workbook Page 2 of 14 MS Excel 2013 Example 3 (“Common PC Shortcuts” worksheet) Select All Save Cut Copy Paste Bold Italics Find/Search Display Formulas Display Print Menu Page 3 of 14 MS Excel 2013 MS Excel 2013 Outline Formatting Example 1 (“Formatting” worksheet) Home Tab Select All | Resize Columns Select All | Resize Rows Borders Fill Color Orientation – rotate Alignment – horizontal & vertical Merge & Center – each line Comma Style & Decimals Format Painter Conditional Formatting Wrap Text (or Alt-Enter) Review Tab Comments View Tab (screen options) Freeze Panes Split worksheet Gridlines Page Layout Tab (printout options) Page Setup Group| Page Setup dialog |Sheet Tab| Print | Gridlines -OR- Sheet Options Group | Gridlines view and/or print Page Setup Group | Print Titles | Sheet Tab | Row & Column Headings -OR- sheet options group | Headings view and/or print Page Setup Group | Print Titles | Sheet Tab | Rows to repeat at top or columns at left -OR- Page Setup group | Print Titles | … Page Setup Group | Breaks | Insert Page Break Margins Tab Insert Tab Header & Footer MIS 1305 Excel insert file: | insert sheet o Special codes: File Name, Sheet Name, Date, Time Page 4 of 14 MS Excel 2013 Example 2 (“NumberFormats” worksheet) Home tab Clearing a Cell editing group Format as Table styles group Currency Formats: number group o Accounting style o Currency style Date Formats: number group o Short o Long o Custom Data Bars styles group, conditional formatting Example 3 (“Sorting” worksheet) Data Tab (also on Home tab, Editing group) Sort Order o Ascending o Descending Sort Fields o Single-field Sort o Multi-field Sort Example 4 (“You Do It_Formatting” worksheet) – optional but strongly recommended Partial Example of desired look when printed (footer not shown): Page 5 of 14 MS Excel 2013 MS Excel 2013 Outline Formulas & Functions - If, Lookup Functions - Linear & Growth Trends - Loan & Investment Functions Example 1 (“Formulas” worksheet) Formulas Basic formulas Complex formulas o Order of Precedence: ( ), ^, *, /, +, -, Left-to-right Formula View o Show Formulas o Shortcut #1 Rule: Example 2 (“Basic Functions” worksheet) Basic Statistical Functions SUM o AutoSum o SUM, and Bad examples AVERAGE MEDIAN MIN & MAX ROUND COUNT COUNTA COUNTIF Nested Functions Page 6 of 14 MS Excel 2013 Example 3 (“Dates” worksheet) Basic Date Functions TODAY NOW YEAR MONTH DAY WEEKDAY Calculations with Dates Example 4 (“RelativeRef”, “AbsoluteRef”, and “RunningSum” worksheets) Types of Referencing Relative Reference Absolute Reference Mixed Reference Example 5 (“IF1” and “IF2” worksheets) Logical Functions IF o =IF(logical_test, [value_if_true], [value_if_false]) Nested IF o =IF(logical_test, [value_if_test_true], IF(logical_test2, [value_if_test2_true], [value_if_test2_false]) ) Page 7 of 14 MS Excel 2013 Example 6 (“Lookup” worksheet) Lookup Functions =VLOOKUP(lookup_value, table_array, column_index_number, [range_lookup]) Lookup_value Table_array Column_index_number Range_lookup =HLOOKUP(lookup_value, table_array, row_index_number, [range_lookup]) Row_index_number Example 7 (“Errors” worksheet) Handling Errors IFERROR o =IFERROR( expression, value_if_expression_generates_error) Page 8 of 14 MS Excel 2013 Example 8 (“PMT” and “PPMT&IPMT” worksheets) Basic Financial Functions Formulas tab | Insert Function Amortization Schedule PMT PPMT IPMT =PMT (rate, nper, pv, fv, type) Rate Nper PV FV Type =PPMT (rate, per, nper, pv, fv, type) =IPMT (rate, per, nper, pv, fv, type) Per Example 9 (“Fill Growth Series” worksheet) Projecting Future Values Linear (constant amount) and Growth (constant percentage) Trends Uses Autofill to fill in series of values o First specify (i.e., highlight) desired starting and ending values o Home | Editing | Fill | Series… Page 9 of 14 MS Excel 2013 MS Excel 2013 Outline Sales ($U.S.) Thousands Charts $2,500 $2,000 Telescope Sales by Region 2,160 $1,858 $1,500 $914 921 $1,000 $375 417 $500 210 158 140 $USA BrightStar 6 Europe Regions BrightStar 8 NightVision 16 Chart Terminology (label the objects) Chart Area, Category Axis, Data Marker, Tick Marks, Titles: Labels: Legend Plot Area Value Axis Data Series Gridlines (NOT SHOWN) Chart, Category, Value Category, Value, Data Common Chart Types *Column Chart Stacked Column Chart Line Chart * Pie Charts *we’re doing these Page 10 of 14 Asia MS Excel 2013 Creating a Chart Identifying the Chart Data Select a Chart Type o Column o Pie Layout Tab o Legend o Data Labels o Format Selected Objects i. Slice “Explosion” ii. Fill Color, … o Chart Title o Axis Titles o Change Units i. Layout Tab | Axes group | Primary Vertical Axis | Show Axis in Hundreds o Gridlines o Walls o Data Table o Chart Rotation o Chart Name Design Tab o Selecting/Editing Chart Data o Name Chart object o Move Chart o Modify Chart Style o Switch Row & Column Format Tab o Shape Styles i. Fill ii. Outline o Chart Size Can copy Charts to other Office products Page 11 of 14 MS Excel 2013 MS Excel 2013 Outline Tables & Pivot Tables Example 1 (“Subtotals” worksheet) Subtotals Must first Sort the data Data Tab | Outline group| Subtotal icon Level / Detail Buttons Data Tab | Outline | Subtotal | Remove All Example 2 (“Filters” worksheet) Filter Filter on : o exact values o range Custom Filter Combining Filters Page 12 of 14 MS Excel 2013 Example 3 (“Tables” worksheet) Tables Insert Tab | Tables group | Table icon Can have more than 1 table on a worksheet Table has Name, Records, Fields o Rename Table (Design tab | Properties | Table Name) Totals Row (Table Design tab; check Totals Row box) Formatting Table (Table Tools Design | Table Style Options) Add/Delete Records Splitting Table Benefits of tables o Adds AutoFilter for each Field o Makes the Table Contextual Tab available o Auto formatting o Totals row o Table Analysis tools (requires add-in), etc… Removing Table Object (Design tab | Tools | Convert to Range) Example 4 (“Pivot Tables” worksheet) Pivot Tables Create Pivot Table o Insert Tab | Tables group| PivotTable icon Set up the Pivot Table report o Choose Row and Column Labels o Choose Values o Optional: Report Filter Select the Function Format Numbers Slicer o Add: Options tab | Sort & Filter | Insert Slicer i. One for each field selected o Remove: right-click and choose Remove “slicer_name” Format Pivot Table o Styles: Design tab | PivotTable Styles | choose Pivot Style o Layout: Design tab | Layout | Report Layout i. Show in Compact Form ii. Show in Tabular Form Refresh the data as needed o Options | Refresh Page 13 of 14 MS Excel 2013 MS Excel 2013 Outline Multiple Worksheets & Workbooks Linking to a Cell… On Another Worksheet worksheetname!cellreference On Another Workbook ‘[filename]worksheet’!cellreference Page 14 of 14
