Ch 10 Multiple choose: Which of the following does NOT represent a
advertisement
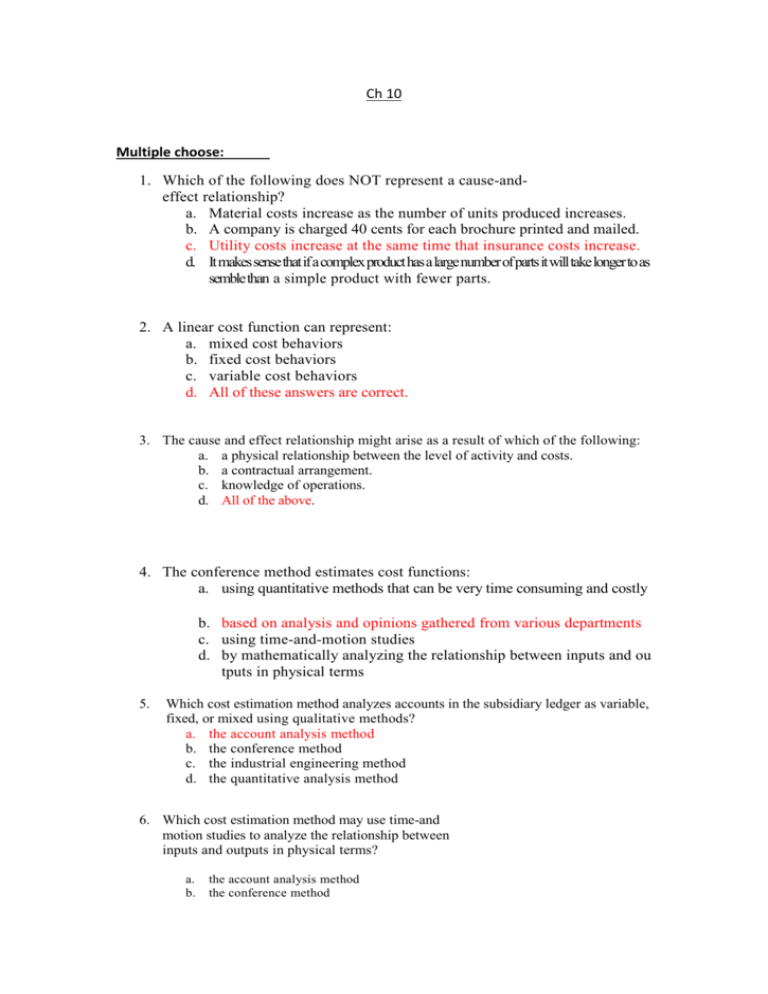
Ch 10 Multiple choose: 1. Which of the following does NOT represent a cause-andeffect relationship? a. Material costs increase as the number of units produced increases. b. A company is charged 40 cents for each brochure printed and mailed. c. Utility costs increase at the same time that insurance costs increase. d. It makes sense that if a complex product has a large number of parts it will take longer to as semble than a simple product with fewer parts. 2. A linear cost function can represent: a. mixed cost behaviors b. fixed cost behaviors c. variable cost behaviors d. All of these answers are correct. 3. The cause and effect relationship might arise as a result of which of the following: a. a physical relationship between the level of activity and costs. b. a contractual arrangement. c. knowledge of operations. d. All of the above. 4. The conference method estimates cost functions: a. using quantitative methods that can be very time consuming and costly b. based on analysis and opinions gathered from various departments c. using time-and-motion studies d. by mathematically analyzing the relationship between inputs and ou tputs in physical terms 5. Which cost estimation method analyzes accounts in the subsidiary ledger as variable, fixed, or mixed using qualitative methods? a. the account analysis method b. the conference method c. the industrial engineering method d. the quantitative analysis method 6. Which cost estimation method may use time-and motion studies to analyze the relationship between inputs and outputs in physical terms? a. b. the account analysis method the conference method c. d. the industrial engineering method the quantitative analysis method 7. The cost to be predicted is referred to as the: a. independent variable b. dependent variable c. cost driver d. regression 8. The independent variable: a. is also referred to as the cost driver b. may also be called the costallocation base if referring to an indirect cost c. should have an economically plausible relationship with the dependent varia ble d. All of these answers are correct 9. When using the high low method, the two observations used are the high and low observations of the: a. cost driver b. dependent variables c. slope coefficient d. residual term 10. A plot of data that results in one extreme observation most likely indicates that: a. b. c. d. more than one cost pool should be used an unusual event such as a plant shutdown occurred during that month the cost-allocation base has been incorrectly identified individual cost items do not have the same cost driver T/F 14) One assumption frequently made in cost behavior estimation is that changes in tot al costs can be explained by changes in the level of a single activity. ( T ) 15) A cost function is a mathematical description of how a cost changes with changes in the level of an activity relating to that cost ( t ) 16) All cost functions are linear ( f) 20) The longer the time horizon, the more likely a cost will be variable( t) 2) A linear cost function can only represent fixed cost behavior.( f)

