Auxiliary material12
advertisement
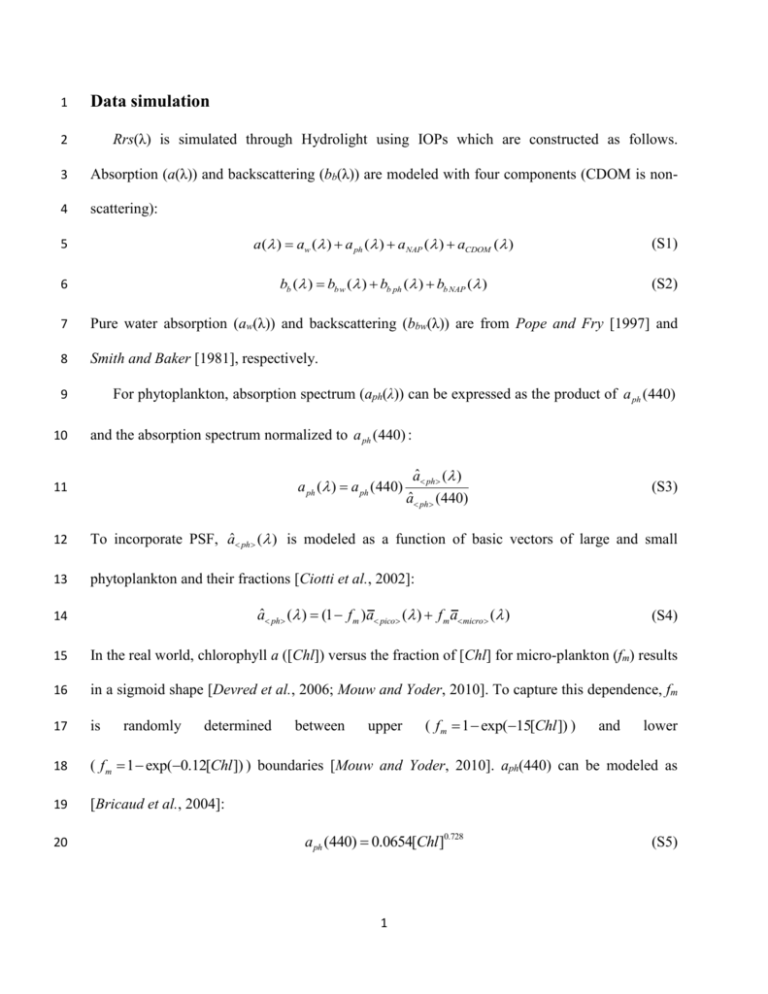
1 Data simulation 2 Rrs(λ) is simulated through Hydrolight using IOPs which are constructed as follows. 3 Absorption (a(λ)) and backscattering (bb(λ)) are modeled with four components (CDOM is non- 4 scattering): 5 a ( ) aw ( ) a ph ( ) aNAP ( ) aCDOM ( ) (S1) 6 bb ( ) bb w ( ) bb ph ( ) bb NAP ( ) (S2) 7 Pure water absorption (aw(λ)) and backscattering (bbw(λ)) are from Pope and Fry [1997] and 8 Smith and Baker [1981], respectively. 9 10 For phytoplankton, absorption spectrum (aph(λ)) can be expressed as the product of a ph (440) and the absorption spectrum normalized to a ph (440) : a ph ( ) a ph (440) 11 aˆ ph ( ) aˆ ph (440) (S3) 12 To incorporate PSF, aˆ ph ( ) is modeled as a function of basic vectors of large and small 13 phytoplankton and their fractions [Ciotti et al., 2002]: 14 aˆ ph ( ) (1 f m )a pico ( ) f m a micro ( ) 15 In the real world, chlorophyll a ([Chl]) versus the fraction of [Chl] for micro-plankton (fm) results 16 in a sigmoid shape [Devred et al., 2006; Mouw and Yoder, 2010]. To capture this dependence, fm 17 is 18 ( f m 1 exp(0.12[Chl ]) ) boundaries [Mouw and Yoder, 2010]. aph(440) can be modeled as 19 [Bricaud et al., 2004]: 20 randomly determined between upper ( f m 1 exp(15[Chl ]) ) a ph (440) 0.0654[Chl ]0.728 1 (S4) and lower (S5) 21 Particle attenuation, even for strongly absorbing particles, can be modeled as a smoothly varying 22 function (Equation 6 in Roesler and Boss [2003]), and has been tested for coastal water. Here, 23 we assume that phytoplankton attenuation ( c ph ( ) ) can also be modeled with this smoothly 24 varying function: ph 25 26 27 550 c ph ( ) c ph (550) (S6) c ph ( ) slope ( ph ) and c ph (550) are modeled as [Lee, 2006]: ph 0.4 1.6 1.21 1 [Chl ]0.5 (S7) 28 c ph (550) cph _ coef [Chl ]0.57 29 where cph _ coef is a random number between 0.06 and 0.6, and 1 is a random value between 30 0 and 1 and used to model the scatter in ph versus [Chl]. Phytoplankton backscattering 31 spectrum ( bb ph ( ) ) is calculated as follows: (S8) 32 bb ph ( ) bphbph ( ) (S9) 33 bph ( ) c ph ( ) a ph ( ) (S10) 34 where b ph is phytoplankton backscattering probability. As b ph varies across regions, it is 35 modeled as a random value between 0.5% [Morel, 1988] and 1.0% [Lee, 2006]. 36 NAP absorption spectrum ( aNAP ( ) ) is modeled as: 37 aNAP ( ) aNAP (440) exp(S NAP ( 440)) 38 where NAP absorption slope ( S NAP ) is a random variable obeying Gaussian distribution, with 39 mean of 0.0123 nm-1 and standard deviation of 0.0013 nm-1 [Babin et al., 2003]. In the real 2 (S11) 40 world, aNAP (440) depends on a ph (440) , especially for open oceanic waters. To capture this 41 dependence, we model aNAP (440) as [Lee, 2006]: 42 0.52 a ph (440) aNAP (440) 0.1 a ph (440) 0.05 a (440) ph 43 where 2 is a random value between 0 and 1. NAP backscattering spectrum ( bbNAP ( ) ) is 44 modeled as [Lee, 2006]: 45 bbNAP ( ) bNAPbNAP ( ) 46 550 bNAP ( ) bNAP (550) (S12) (S13) NAP 47 48 bNAP (550) bnap _ coef [Chl ]0.766 NAP 0.5 2.0 1.23 1 [Chl ]0.5 (S14) (S15) (S16) 49 where bdm _ coef is a random value between 0.06 and 0.6, and 3 is a random value between 0 50 and 1. bNAP is NAP backscattering probability. It is arbitrary set as a uniform distribution 51 between 1.0% and 4.0%, which is higher than the upper boundary of b ph (1.0%) and lower than 52 a maximum around 4.0% [Boss et al., 2004; Whitmire et al., 2007]. This range also covers the 53 Petzold averaged particle backscattering probability (1.83%). 54 CDOM absorption spectrum ( aCDOM ( ) ) is modeled as: 55 aCDOM ( ) aCDOM (440) exp(SCDOM ( 440)) 56 where CDOM absorption slope ( SCDOM ) is a random variable obeying Gaussian distribution, 57 with mean of 0.0176 nm-1 and standard deviation of 0.0020 nm-1 [Babin et al., 2003]. Note that 58 the distributions of SCDOM and S NAP in Babin et al. [2003] are derived from costal water around 3 (S17) 59 Europe. However, the range also covers the value of most open oceanic water. Therefore, we 60 adopt them to simulate dataset. As CDOM depends on phytoplankton, especially for open 61 oceanic waters, we model aCDOM (440) as [Lee, 2006]: 62 aCDOM (440) pa ph (440) 63 p 0.3 5.74 a ph (440) 0.02 a ph (440) (S18) (S19) 64 4 is a random value between 0 and 1. 65 References 66 Babin, M., D. Stramski, G. M. Ferrari, H. Claustre, A. Bricaud, G. Obolensky, and N. Hoepffner 67 (2003), Variations in the light absorption coefficients of phytoplankton, nonalgal particles, and 68 dissolved organic matter in coastal waters around Europe, Journal of Geophysical Research- 69 Oceans, 108(C7). 70 Boss, E., W. S. Pegau, M. Lee, M. Twardowski, E. Shybanov, G. Korotaev, and F. Baratange 71 (2004), Particulate backscattering ratio at LEO 15 and its use to study particle composition and 72 distribution, Journal of Geophysical Research-Oceans, 109(C1). 73 Bricaud, A., H. Claustre, J. Ras, and K. Oubelkheir (2004), Natural variability of 74 phytoplanktonic absorption in oceanic waters: Influence of the size structure of algal 75 populations, Journal of Geophysical Research-Oceans, 109(C11). 76 Ciotti, A. M., M. R. Lewis, and J. J. Cullen (2002), Assessment of the relationships between 77 dominant cell size in natural phytoplankton communities and the spectral shape of the absorption 78 coefficient, Limnology and Oceanography, 47(2), 404-417. 4 79 Devred, E., S. Sathyendranath, V. Stuart, H. Maass, O. Ulloa, and T. Platt (2006), A two- 80 component model of phytoplankton absorption in the open ocean: Theory and applications, 81 Journal of Geophysical Research-Oceans, 111(C3). 82 Lee, Z. (2006), Remote sensing of inherent optical properties: fundamentals, tests of algorithms, 83 and applications, Reports of the International Ocean-Colour Coordinating Group. 84 Morel, A. (1988), Optical modeling of the upper ocean in relation to its biogenous matter content 85 (case-I waters), Journal of Geophysical Research-Oceans, 93(C9), 10749-10768. 86 Mouw, C. B., and J. A. Yoder (2010), Optical determination of phytoplankton size composition 87 from global SeaWiFS imagery, Journal of Geophysical Research-Oceans, 115. 88 Pope, R. M., and E. S. Fry (1997), Absorption spectrum (380-700 nm) of pure water .2. 89 Integrating cavity measurements, Applied Optics, 36(33), 8710-8723. 90 Roesler, C. S., and E. Boss (2003), Spectral beam attenuation coefficient retrieved from ocean 91 color inversion, Geophys Res Lett, 30(9). 92 Smith, R. C., and K. S. Baker (1981), Optical properties of the clearest natural waters, Applied 93 Optics, 20(2), 177-184. 94 Whitmire, A. L., E. Boss, T. J. Cowles, and W. S. Pegau (2007), Spectral variability of the 95 particulate backscattering ratio, Opt Express, 15(11), 7019-7031. 96 97 5
