oltmanns-Diffraction and Interference
advertisement
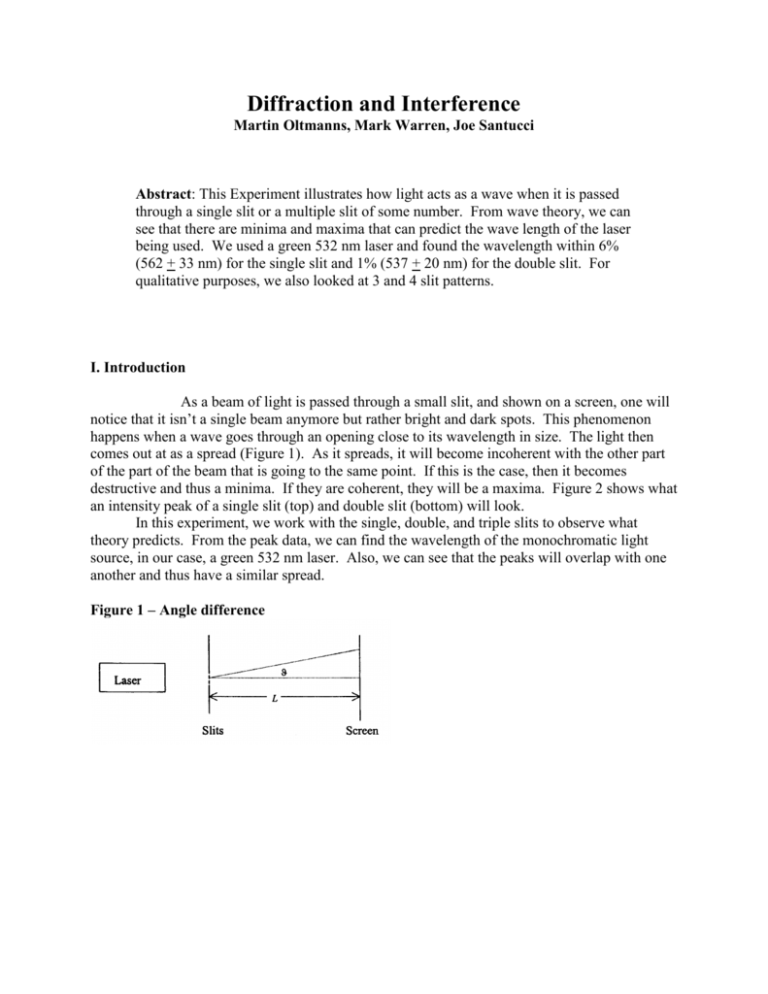
Diffraction and Interference Martin Oltmanns, Mark Warren, Joe Santucci Abstract: This Experiment illustrates how light acts as a wave when it is passed through a single slit or a multiple slit of some number. From wave theory, we can see that there are minima and maxima that can predict the wave length of the laser being used. We used a green 532 nm laser and found the wavelength within 6% (562 + 33 nm) for the single slit and 1% (537 + 20 nm) for the double slit. For qualitative purposes, we also looked at 3 and 4 slit patterns. I. Introduction As a beam of light is passed through a small slit, and shown on a screen, one will notice that it isn’t a single beam anymore but rather bright and dark spots. This phenomenon happens when a wave goes through an opening close to its wavelength in size. The light then comes out at as a spread (Figure 1). As it spreads, it will become incoherent with the other part of the part of the beam that is going to the same point. If this is the case, then it becomes destructive and thus a minima. If they are coherent, they will be a maxima. Figure 2 shows what an intensity peak of a single slit (top) and double slit (bottom) will look. In this experiment, we work with the single, double, and triple slits to observe what theory predicts. From the peak data, we can find the wavelength of the monochromatic light source, in our case, a green 532 nm laser. Also, we can see that the peaks will overlap with one another and thus have a similar spread. Figure 1 – Angle difference Figure 2 – Single and Double Slit interference II. Experimental Setup For this experiment, there were two parts. The first entailed using a single slit with a green laser to find its wavelength. The apparatus for this included a 532 nm green laser, a slit having a width of 0.04 mm, an optics bench, rotary motion sensor, linear translator, and a light sensor. (Figure 3) Distance L from the slit to the sensor is measured. Then using scientific workshop we scanned the diffraction pattern by moving the light sensor from one side to the other. Our data clearly showed at least 5 peaks so no repetitions were needed. From the central peak, and the minima on either side of the peak the wave length can be determined. Figure 4- Apparatus setup Next, we gathered data using the double slit with a width of a=0.04 mm and separation of d=0.125 mm. The same processed is used for double, triple, and quadruple slit as was used for the single slit. Once this is done, we did the triple and quadruple slit. Some adjustments were made to make the secondary minima more distinct. III. Results We measure the wavelength with the single slit to be 562 + 33 nm, and with the double slit to be 537 + 20 nm. The first is almost 6% off of the 532 nm stated on the laser and the second is only about 1% off of the known value. These values are calculated by dividing the position given by Scientific Workshop by the distance L (equation 1) the slit is away from the sensor. This angle, which in the case of the single slit is divided by 2, is then put in to equation 2. For the double slit, equation 3 is use and the angle difference doesn’t have to be divided by two. Figures 5 through 8 show the Intensity of the light as a function of position. In Figure 5, we can see one large peak with smaller peaks on the side. This is for the single slit. As the slits increase to 2, more peaks show up. This group of 5 peaks could be fit under the curve of the single slit, as shown in figure 2, as they decrease when going out from the center. From these peaks, we can get the wavelength through the process stated above. The images of the 3 and 4 slits get more complex as they have the main 5 peaks as well as the smaller secondary peaks. However, these secondary peaks weren’t picked up well by the sensor, but they were noticeable to the eye. Table 2 lists all of the peaks with their position and intensity for 2, 3, and 4 slits. Figure 9 demonstrates that the main peaks for 2, 3, and 4 slits can all be fitted over one another along with a theoretical intensity curve. Equation 2 is the fitting function for this curve in Figure 9. As we can see, theory predicts what the experiment says very well. Also, all of the peaks once normalized fit over one another. Table 1 Wavelength (nm) 562 + 33 nm 537 + 20 nm Single Slit Double Slit Percent error 5.63% 0.94% Equation 1 – Single slit needs angle difference divided by 2. Equation 2 – Single Slit Equation 3 – Multiple Slit Figure 5 – Single slit 0 1.0 2.0 Run #35 Intensity (% max) 3.0 4.0 5.0 6.0 Graph Display 6.0 6.5 7.0 7.5 8.0 8.5 9.0 9.5 10.0 Run #35 10.5 11.0 11.5 12.0 12.5 13.0 13.5 Position (cm) Table 2- Peak data with pixel to pixel error listed 2 Slit cm (+ 0.008) 9.306 9.673 10.223 10.626 11.015 11.44 11.851 12.313 12.731 13.237 13.615 % (+ 0.037) 1.415 1.112 1.187 8.389 22.565 29.995 23.702 9.147 1.187 0.96 1.718 3 Slit cm (+ 0.004) 7.161 7.606 8.094 8.515 8.908 9.359 9.799 10.179 10.619 11.041 11.468 % (+ 0.072) 2.611 2.081 0.794 12.895 40.925 56.598 40.696 13.515 0.794 2.006 2.763 4 Slit cm (+ 0.008) 11.831 12.286 12.735 13.142 13.67 14.011 14.384 14.839 15.246 15.695 16.116 % (+ 0.12) 5.722 3.426 2.704 30.713 76.831 90.594 85.644 27.091 1.859 3.669 5.239 Figure 6 – Double slit 0 1 2 3 4 5 6 7 8 9 10 11 12 13 Run #36 Intensity (% max) 14 15 16 17 18 19 20 21 22 23 24 25 26 27 28 29 30 Graph Display 9.0 9.5 10.0 10.5 11.0 11.5 Run #36 12.0 12.5 13.0 13.5 14.0 Position (cm) Figure 7 – 3 slit 0 2 4 6 8 10 12 14 16 18 20 22 24 Run #37 Intensity (% max) 26 28 30 32 34 36 38 40 42 44 46 48 50 52 54 56 58 Graph Display 6.8 7.0 7.2 7.4 7.6 7.8 8.0 8.2 8.4 8.6 8.8 9.0 9.2 9.4 Run #37 Position (cm) 9.6 9.8 10.0 10.2 10.4 10.6 10.8 11.0 11.2 11.4 11.6 11.8 12.0 Figure 8 – 4 slit 0 5 10 15 20 25 30 35 Run #38 Intensity (% max) 40 45 50 55 60 65 70 75 80 85 90 Graph Display 11.5 12.0 12.5 13.0 13.5 14.0 Run #38 14.5 15.0 15.5 16.0 16.5 17.0 Position (cm) Equation 4 – Curve fit function Figure 9 - Fitted curve with 2, 3, 4 slit max constructive interference IV. Discussion As we can see, the data from the double slit is clearly better than that of the single slit (table 1). In fact, the error for the single slit should probably be worse than what it is. Having multiple slits provides a sharper peak. This is why I say that the error should probably be worse. We didn’t account for the problem of the detector not being able to show a clear peak. The graph for the single slit has a flat top to it. This wasn’t the case for the double slit which had a sharp top to each peak. For error, just the pixel to pixel difference for position and intensity were taken into account. Having shaper peaks means that we can be more certain about the point we pick. The single slit doesn’t have as many interference points and therefore can’t provide nearly as sharp a peak as the double slit. Having a more precise linear translator would probably have helped the error a great deal. Having this would mean having more data points and possible even sharper peaks. This would reduce the error even more and make it so that human error really would be the only source. The main source of human error would have been in measuring L. I say this because unless the reading of the peaks was somehow fouled up, the only error here is pixel to pixel uncertainty. L in fact is the hardest part to measure. For our apparatus, we had to use 2 tracks which means there was some uncertainty in the joining space between the two. The other problem is measuring where the detector is which can be parallax prone since the reader is having to look above the plate. The same goes for the slit plate. This is probably going to be the biggest source of human error. However, for the single slit in our case, find the peak would be the most error prone since it has a non-noticeable peak as stated above. Also, for the multiple slits as to which contributes more error, it is probably more likely to be the length, but that’s not to say that the pixel to pixel uncertainty wasn’t large. It also may have contributed a significant amount. Even with the error in the single slit, we were able to find the wave length within 6% error. The double slit was even better with only 1% error. Having a better more precise setup as well as not having 2 tracks, but having 1 track would have meant a much lower uncertainty and a much closer value to the known wave length. V. Conclusion As we have shown in this experiment, diffraction can show the wavelength of monochromatic light to close values of the know wavelength. Also, theory and the experimental data fit very similarly to one another. Theory from the observation of other than light waves says that as light passes through something comparable to its wave length, it will diffract and interfere with itself. This has been shown to be true and gives us a better understanding of waves. However, for measuring precisely the interference in waves, this is not a great method. The Michelson Interferometer would be better suited for such work seeing as it is both more precise and has fewer places for error especially if a computer analyzes the bright and dark fringes. References Diffraction and interference lab procedure *late -10 *compare experimental and percent error *D(alpha) graph *88-10 = 78%


