principles of laboratory measurement
advertisement
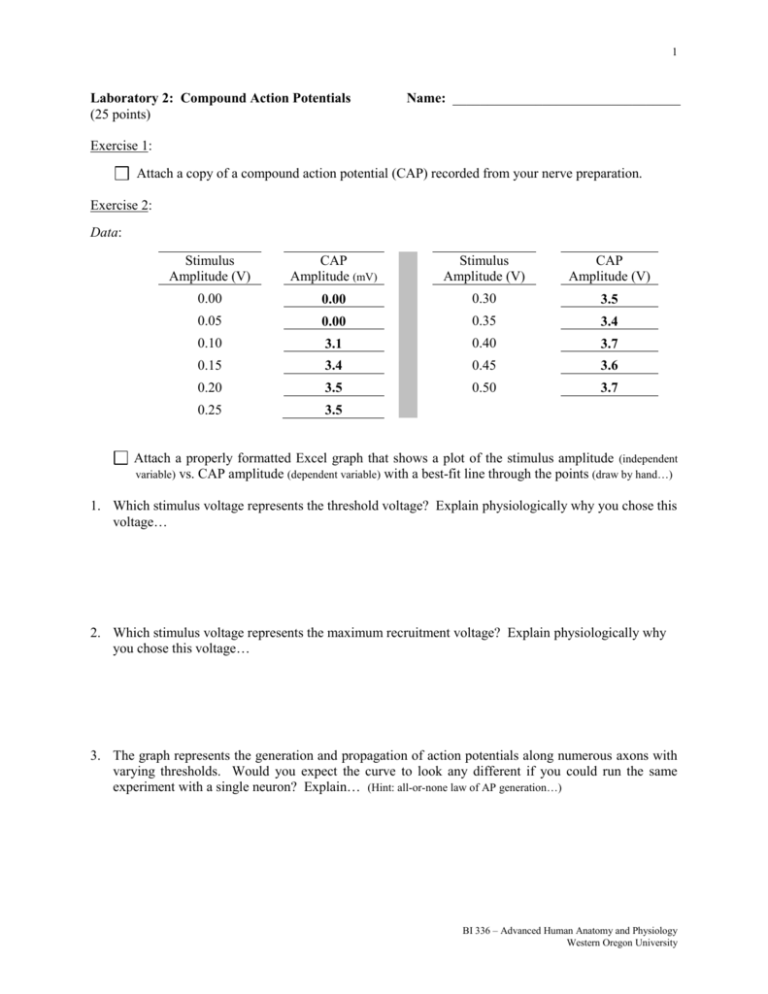
1 Laboratory 2: Compound Action Potentials (25 points) Name: _________________________________ Exercise 1: Attach a copy of a compound action potential (CAP) recorded from your nerve preparation. Exercise 2: Data: Stimulus Amplitude (V) CAP Amplitude (mV) Stimulus Amplitude (V) CAP Amplitude (V) 0.00 0.00 0.30 3.5 0.05 0.00 0.35 3.4 0.10 3.1 0.40 3.7 0.15 3.4 0.45 3.6 0.20 3.5 0.50 3.7 0.25 3.5 Attach a properly formatted Excel graph that shows a plot of the stimulus amplitude (independent variable) vs. CAP amplitude (dependent variable) with a best-fit line through the points (draw by hand…) 1. Which stimulus voltage represents the threshold voltage? Explain physiologically why you chose this voltage… 2. Which stimulus voltage represents the maximum recruitment voltage? Explain physiologically why you chose this voltage… 3. The graph represents the generation and propagation of action potentials along numerous axons with varying thresholds. Would you expect the curve to look any different if you could run the same experiment with a single neuron? Explain… (Hint: all-or-none law of AP generation…) BI 336 – Advanced Human Anatomy and Physiology Western Oregon University 2 Exercise 3: Data: Distance between recording electrode placements: Time delay between recording electrode placements: 4 (mm) 0. 3 (msec) 4. Calculate the compound action potential velocity (m / s): (Remember: Velocity = distance / time) Exercise 4: Data: Distance between recording electrode placements: Time delay between recording electrode placements: 4 (mm) 0. 4 (msec) 5. Calculate the compound action potential velocity (m / s): (Remember: Velocity = distance / time) 6. Compare your results from Exercise 3 with your results from Exercise 4. Does the conduction velocity change when the sciatic nerve is cooled? What properties of the ion channels may change with temperature? BI 336 – Advanced Human Anatomy and Physiology Western Oregon University 3 Exercise 5: Data: Time between stimuli (ms) 1st CAP (V) 2nd CAP (V) Time between stimuli (ms) 1st CAP (V) 2nd CAP (V) 8 1.8 1.7 4 2.0 1.5 7 2.0 1.7 3 2.0 1.0 6 1.9 1.8 2 2.0 0.6 5 2.0 1.7 1 1.9 0.0 Attach a properly formatted Excel graph that shows a plot of the time between stimuli (independent variable) vs. 2nd CAP amplitude (dependent variable) with a best-fit line through the points (draw by hand…). 7. At which frequency do you begin to observe the second stimulation occurring during the relative refractory period for the axons in the sciatic nerve? Explain why you chose this frequency… 8. At which frequency do you begin to observe the second stimulation occurring during the absolute refractory period for the axons in the sciatic nerve? Explain why you chose this frequency… BI 336 – Advanced Human Anatomy and Physiology Western Oregon University
