Example 7 – CA SAT Scores
advertisement
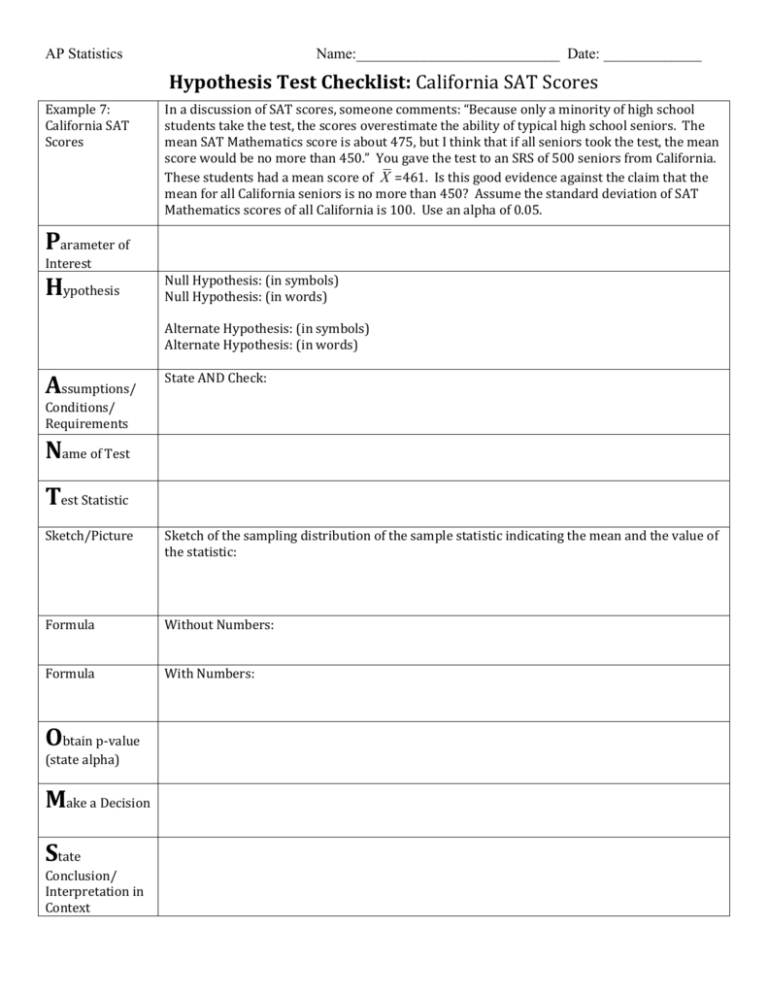
AP Statistics Name:___________________________ Date: _____________ Hypothesis Test Checklist: California SAT Scores Example 7: California SAT Scores In a discussion of SAT scores, someone comments: “Because only a minority of high school students take the test, the scores overestimate the ability of typical high school seniors. The mean SAT Mathematics score is about 475, but I think that if all seniors took the test, the mean score would be no more than 450.” You gave the test to an SRS of 500 seniors from California. These students had a mean score of X =461. Is this good evidence against the claim that the mean for all California seniors is no more than 450? Assume the standard deviation of SAT Mathematics scores of all California is 100. Use an alpha of 0.05. Parameter of Interest Hypothesis Null Hypothesis: (in symbols) Null Hypothesis: (in words) Alternate Hypothesis: (in symbols) Alternate Hypothesis: (in words) Assumptions/ State AND Check: Conditions/ Requirements Name of Test Test Statistic Sketch/Picture Sketch of the sampling distribution of the sample statistic indicating the mean and the value of the statistic: Formula Without Numbers: Formula With Numbers: Obtain p-value (state alpha) Make a Decision State Conclusion/ Interpretation in Context

