Supplementary Material - Springer Static Content Server
advertisement
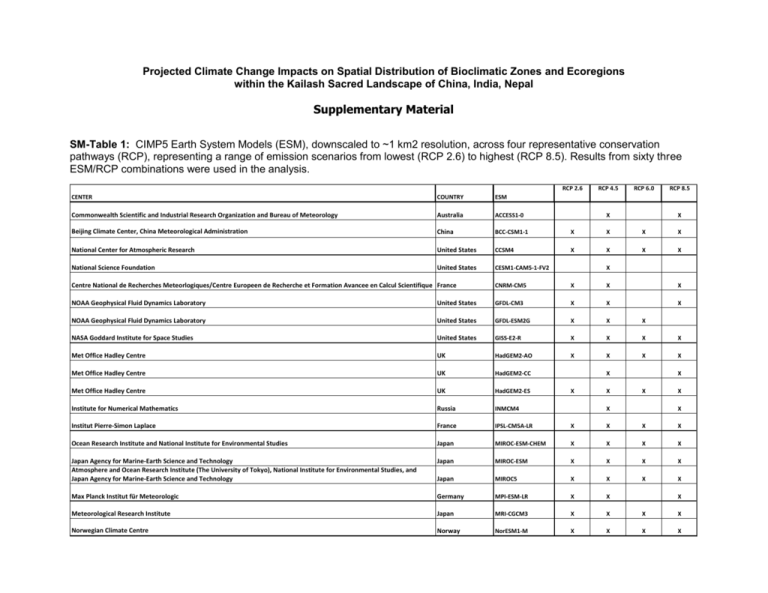
Projected Climate Change Impacts on Spatial Distribution of Bioclimatic Zones and Ecoregions within the Kailash Sacred Landscape of China, India, Nepal Supplementary Material SM-Table 1: CIMP5 Earth System Models (ESM), downscaled to ~1 km2 resolution, across four representative conservation pathways (RCP), representing a range of emission scenarios from lowest (RCP 2.6) to highest (RCP 8.5). Results from sixty three ESM/RCP combinations were used in the analysis. RCP 2.6 RCP 4.5 RCP 6.0 RCP 8.5 CENTER COUNTRY ESM Commonwealth Scientific and Industrial Research Organization and Bureau of Meteorology Australia ACCESS1-0 Beijing Climate Center, China Meteorological Administration China BCC-CSM1-1 X X X X National Center for Atmospheric Research United States CCSM4 X X X X National Science Foundation United States CESM1-CAM5-1-FV2 X X X Centre National de Recherches Meteorlogiques/Centre Europeen de Recherche et Formation Avancee en Calcul Scientifique France CNRM-CM5 X X X NOAA Geophysical Fluid Dynamics Laboratory United States GFDL-CM3 X X X NOAA Geophysical Fluid Dynamics Laboratory United States GFDL-ESM2G X X X NASA Goddard Institute for Space Studies United States GISS-E2-R X X X X Met Office Hadley Centre UK HadGEM2-AO X X X X Met Office Hadley Centre UK HadGEM2-CC Met Office Hadley Centre UK HadGEM2-ES Institute for Numerical Mathematics Russia INMCM4 Institut Pierre-Simon Laplace France IPSL-CM5A-LR X X X X Ocean Research Institute and National Institute for Environmental Studies Japan MIROC-ESM-CHEM X X X X Japan Agency for Marine-Earth Science and Technology Atmosphere and Ocean Research Institute (The University of Tokyo), National Institute for Environmental Studies, and Japan Agency for Marine-Earth Science and Technology Japan MIROC-ESM X X X X Japan MIROC5 X X X X Max Planck Institut für Meteorologic Germany MPI-ESM-LR X X Meteorological Research Institute Japan MRI-CGCM3 X X X X Norwegian Climate Centre Norway NorESM1-M X X X X X X X X X X X X X SM-Table 2: Global and regional geospatial datasets used in the KSL-Ens analysis. SM-Table 3: Description of KSL-EnS Bioclimatic Zones A brief description of the KSL-EnS bioclimatic zones is given below. Extremely Cold and Wet (KSL-EnS Zones C and D) The extremely cold zones (Zones C and D) are found at the highest elevations and cross the Himalaya ridge onto the arid and continental Tibetan plateau, which is sheltered by the Himalayan range from the Asian monsoon. Extremely cold and moist climate zones (Zone C and D) and strata (Strata C2, D1, D2 and D3) coincide with what is generally referred to as “nival zones”, mostly above 5500 meters, with an average elevation of over 6,500 m. These strata are typically covered by permanent glaciers and snow on the Himalayan ridges and mountain tops, or barren land with seasonal snow. On the Tibetan plateau this includes barren land with seasonal snow and glaciers on the mountain tops. The average mean annual temperature for these extremely cold zones (C and D) is – 11.0° C. Low estimated PET rates at these extreme altitudes means that these areas are considered wet, with very wet aridity index values, in spite of relatively low precipitation. However, this does not take into account the high solar radiation effects, sublimation (as opposed to evaporation) of moisture, and the very heterogeneous and diverse climatic conditions at these extreme high elevations. More than 3400 km2 of area is included in this zone. Extremely Cold and Mesic (Zone F) The extremely cold and mesic zone (F) can be characterized as “alpine”, although on the Tibetan plateau most of this should be considered as high altitude cold desert. This zone is comprised of five strata, covering most ecosystems in KSL-China below 6000m, but including high Himalayan and transHimalayan valleys within Nepal and India. Strata F4 covers most of the northernmost part of KSL-China, referred to as West Tibetan Plateau Alpine Steppe. As a result of overestimation of precipitation on the Tibetan Plateau, much of this area might be more xeric rather than mesic, even though the analysis shows an average Aridity Index for these area that would imply a more wet climate. A small portion of the F4 strata is found in India and Nepal, and can be integrated with the F7 and F8 strata, all together denoting Upper TransHimalaya Alpine Meadows. Likewise, the F13 stratum can be subdivided with a portion in China, identified as the Grandise Mountains Alpine Tundra, while the portion in India and Nepal (together with F15) can be aggregated as the Upper Trans-Himalaya Alpine Meadows ecoregion. Grandise Mountains Alpine Tundra is differentiated from West Tibetan Plateau Alpine Steppe, having a larger portion of open shrubland (35% vs 15%) and a lower portion of barren land (45% vs 60%). Upper Trans-Himalaya Alpine Meadows include some limited presence of glaciers, and a significant amount of area with permanent and seasonal snow, and supports primarily shrub and grassland vegetation types. This zone covers almost 16,000 km2, with an average mean annual temperature of -1.0° C, and an average elevation of 4,800 m. Cold and Mesic (Zone G) Although this zone, comprised of six strata, is generally defined as cold and mesic, significant portions of strata G7 and G11 are xeric and found in the upper portion of the Kali Gandaki River within China. The ecosystems in this climate zone (exclusive of the xeric areas on the Tibetan Plateau), are subalpine to alpine, with meadow and shrub vegetation types above treeline, and the presence of scattered trees below the treeline that gradually form closed forest patches at the lower elevational extent of this zone. The three colder climate strata (G4, G7 and G8) in this zone typically supports vegetation corresponding to the Western Himalayan Alpine Shrub and Meadow eco-region, while the three warmer climate strata (G11, G12 and G13) typically support vegetation corresponding to the Western Himalayan Subalpine Conifer Forest Ecoregion. This zone has an average elevation of 3,800m, a mean annual temperature of 4.9° C, and covers just more than 3000 km2. Cool Temperate and Moist (Zones J and H) This cool temperate and moist to mesic climatic zone, also referred to commonly as “upper temperate”, comprised of five strata, lay on the transition between subalpine and temperate zones, and in the KSL is found only within Nepal and India. The colder strata (J1, H5 and J3) lay in the subalpine zone with typical vegetation of Subalpine Mixed Forest. The two warmer, and lower in average elevation, strata (J4 and J5) are within the temperate zone, with typical vegetation corresponding to the Temperate Western Himalayan Conifer Forest Ecoregion. This zone covers 1500 km2, with an average mean annual temperature of 9.3° C, and an average elevation of 3028m. Drier areas of this zone (H5) are included, however, cover just over 100 km2, and are not represented under future climate conditions. Precipitation in this zone averages approximately 1100 mm per year, most of it during the summer monsoon. There are some patches of scattered “cloud forest” found in this zone, a result of orographic effects. Warm Temperate and Mesic (Zone K) This warm temperate and mesic zone, comprised of 7 strata, includes element of both the lower temperate and subtropical zones, and in the KSL is found only in Nepal and India. The colder strata (K1, K2, K5 and K7) correspond to the Western Himalayan Temperate Braodleaf Forest Ecoregion, while the warmer strata (K10, K13 and L3) are Himalayan Subtropical Mixed Forest. The strata K2 is only present under future conditions and it not represented under current conditions. This zone covers more than 4,800 km2, with an average mean annual temperature of 14.8°C, and an average elevation of 2084m. Precipitation in this zone averages approximately 1200 mm per year. Hot and Mesic (Zone N) This hot and dry zone is comprised of five strata (N1, N2, N3, N5 and N8), and is commonly referred to as the subtropical zone. It is associated with the presence of Himalayan Subtropical Pine Forest dominated by Pinus roxburghii (Chir Pine). In the KSL it is only present within Nepal and India. This zone covers 2033 km2, with an average mean annual temperature of 18.5° C, average mean annual precipitation of 1600 mm per year, and an average elevation of 1371 m. Extremely Hot and Mesic (Zone M) This extremely hot and mesic “tropical” zone is comprised of two strata (M2, M8), and at present, under current conditions, has only a limited presence in the KSL. This zone is associated with the “Tropical Broadleaved Forest” ecoregion (i.e. Hill Sal Forest dominated by Shorea robusta) and is found in the lower elevation of the KSL in India and Nepal. This zone covers 440 km2, has an average mean annual temperature of 22° C, average mean annual precipitation of 1885 mm, and average elevation of 737 m. SM-Table 4: The number of CIMP5 Earth System Models (ESM) used in the analysis within each of the four representative concentration pathways (RCP) emission scenarios, and the percentage of ESM within each RCP which were in the majority class of the projected stratification results, i.e. representing the congruence among models within each RCP, and their standard deviation (STD). SM-Table 5: Average mean annual temperature and mean annual precipitation for the KSL averaged from1960-2000, and for each of the four representative concentration pathways (RCP) emission scenarios, and their average, as projected for the year 2050. SM-Table 6: Change in the area of KSL-EnS bioclimatic zones as projected under four emission scenarios or representative concentration pathways (RCPs), and the average of all the RCPs. SM-Table 7: Change in the mean elevation of the KLS-EnS bioclimatic zones as projected by the four emission scenarios or representative conservation pathways (RCPs), and the average of all the RCPs. All zones shift upward, with an average upward shift for all zones of 357 m. SM-Table 8: Change in the mean elevation of the KLS-EnS bioclimatic strata as projected by the four emission scenarios or resource conservation pathways (RCPs), and the average of all the RCPs. Several strata currently found within the KSL are no longer present under projected future climate conditions. Two strata not previously seen in the KSL appear under various RCP-ESM model results. Numbers in parentheses () give the mean elevation for these two newly appearing strata. SM-Table 9: Change in the area of KSL-EnS ecoregions as projected under four emission scenarios or representative concentration pathways (RCPs), and the average of all the RCPs. Area (km 2 ) Ecoregion Nival Zone West Tibetan Plateau Alpine Steppe Grandise Mountains Alpine Tundra Upper Alpine Meadow Alpine Shrub And Meadow Subalpine Conifer Forest Subalpine Mixed Forest Temperate Conifer Forest Temperate Broadleaf Forest Subtropical Pine/Mixed Forest Subtropical Pine Forest Tropical Broadleaf Forest 2000 3478 3186 3309 9385 1015 2031 760 758 2946 1895 2000 447 RCP 2.6 1432 1405 2432 12003 1982 2318 655 1008 2458 1091 3012 1407 RCP 4.5 767 1440 2708 11293 1702 3330 693 938 3381 226 2294 2431 RCP 6.0 1009 1608 2612 11867 1386 2895 667 1033 3020 466 2939 1701 RCP 8.5 623 1205 2072 11184 1974 3945 673 1098 2985 368 1770 3306 RCP Average 958 1415 2456 11587 1761 3122 672 1019 2961 538 2504 2211 -2855 -1981 -1237 1799 959 1914 -87 340 39 -1527 -230 2859 -2520 -1772 -853 2202 746 1091 -88 261 15 -1357 504 1764 -82 -62 -37 19 94 94 -11 45 1 -81 -12 640 -72 -56 -26 23 73 54 -12 34 1 -72 25 395 Change in Area from 2000 (km2 ) Nival Zone West Tibetan Plateau Alpine Steppe Grandise Mountains Alpine Tundra Upper Alpine Meadow Alpine Shrub And Meadow Subalpine Conifer Forest Subalpine Mixed Forest Temperate Conifer Forest Temperate Broadleaf Forest Subtropical Pine/Mixed Forest Subtropical Pine Forest Tropical Broadleaf Forest -2046 -1781 -877 2618 967 287 -105 250 -488 -804 1012 960 -2711 -1746 -601 1908 687 1299 -67 180 435 -1669 294 1984 -2469 -1578 -697 2482 371 864 -93 275 74 -1429 939 1254 Change in Area from 2000 (%) Nival Zone West Tibetan Plateau Alpine Steppe Grandise Mountains Alpine Tundra Upper Alpine Meadow Alpine Shrub And Meadow Subalpine Conifer Forest Subalpine Mixed Forest Temperate Conifer Forest Temperate Broadleaf Forest Subtropical Pine/Mixed Forest Subtropical Pine Forest Tropical Broadleaf Forest -59 -56 -27 28 95 14 -14 33 -17 -42 51 215 -78 -55 -18 20 68 64 -9 24 15 -88 15 444 -71 -50 -21 26 37 43 -12 36 3 -75 47 281 SM - Table 10: Change in the mean elevation of the KLS-EnS bioclimatic zones as projected by the four emission scenarios or representative conservation pathways (RCPs), and the average of all the RCPs. All ecoregions shift upward, with an average upward shift for all ecoregions of 371 m. Mean Elevation (m asl) Ecoregion Nival Zone West Tibetan Plateau Alpine Steppe Grandise Mountains Alpine Tundra Upper Alpine Meadow Alpine Shrub And Meadow Subalpine Conifer Forest Subalpine Mixed Forest Temperate Conifer Forest Temperate Broadleaf Forest Subtropical Pine/Mixed Forest Subtropical Pine Forest Tropical Broadleaf Forest 2000 RCP 2.6 RCP 4.5 RCP 6.0 RCP 8.5 5431 5354 4690 4728 3862 3609 3041 2794 2190 1727 1323 922 5713 5567 4955 4927 4263 3902 3412 3136 2533 2034 1593 1070 5818 5590 5068 4977 4399 4080 3514 3239 2497 2285 1713 1220 5777 5566 4990 4941 4304 4006 3468 3185 2470 2225 1645 1115 5875 5617 5173 5019 4506 4175 3591 3290 2582 2354 1805 1330 RCP Average 5796 5585 5047 4966 4368 4041 3496 3213 2521 2224 1689 1184 Upward Shift in Mean Elevation from 2000 (m) Nival Zone West Tibetan Plateau Alpine Steppe Grandise Mountains Alpine Tundra Upper Alpine Meadow Alpine Shrub And Meadow Subalpine Conifer Forest Subalpine Mixed Forest Temperate Conifer Forest Temperate Broadleaf Forest Subtropical Pine/Mixed Forest Subtropical Pine Forest Tropical Broadleaf Forest 282 213 265 199 401 293 371 342 343 307 270 148 387 236 378 249 537 471 473 445 307 558 390 298 346 212 300 213 442 397 427 391 280 498 322 193 444 263 483 291 644 566 550 496 392 627 482 408 365 231 357 238 506 432 455 419 331 497 366 262 Average Upward Shift (m) 286 394 335 470 371 SM-Table 11: The total area that shifts to another class by 2050 within bioclimatic strata, bioclimatic zones, and ecoregions, and as a percent of the total area of the KSL. SM-Figure 1: Elevation map of the Kailash Sacred Landscape showing the steep elevation gradient up to the crest of the Himalaya, ranging from below 500 to over 7,600 m asl, and the large expanse of very high elevation (>5000 m asl) on the Tibetan Plateau. This transboundary landscape is comprised of portions of the southwestern Tibetan Autonomous Republic of China, and adjacent portions of northern India and northwestern Nepal. SM – Figure 2: The uncertainty among the results from a multi-model CIMP5-ESM ensemble (n=63) applied across four representative concentration pathways (RCP), or emission scenarios. Percent of models in the majority class is shown as a measure of the congruence among models used within each RCP in the results of the classification of KSL-EnS bioclimatic zones. SM – Figure 3: The uncertainty among the results from a multi-model CIMP5 ESM ensemble (n=63) applied across four representative concentration pathways (RCP), or emission scenarios. Percent of models in the majority class is shown as a measure of the congruence among models used within each RCP in the results of the classification of KSL-EnS ecoregions. SM – Figure 4: Average mean annual temperature versus average mean annual precipitation for 63 CMIP-5 model runs within four emission scenarios (RCP; representative concentration pathways) and the average mean annual temperature and precipitation from 1960-2000 (WorldClim – 2000), for the Kailash Sacred Landscape.
