Opportunity Definition & Assessment Template
advertisement
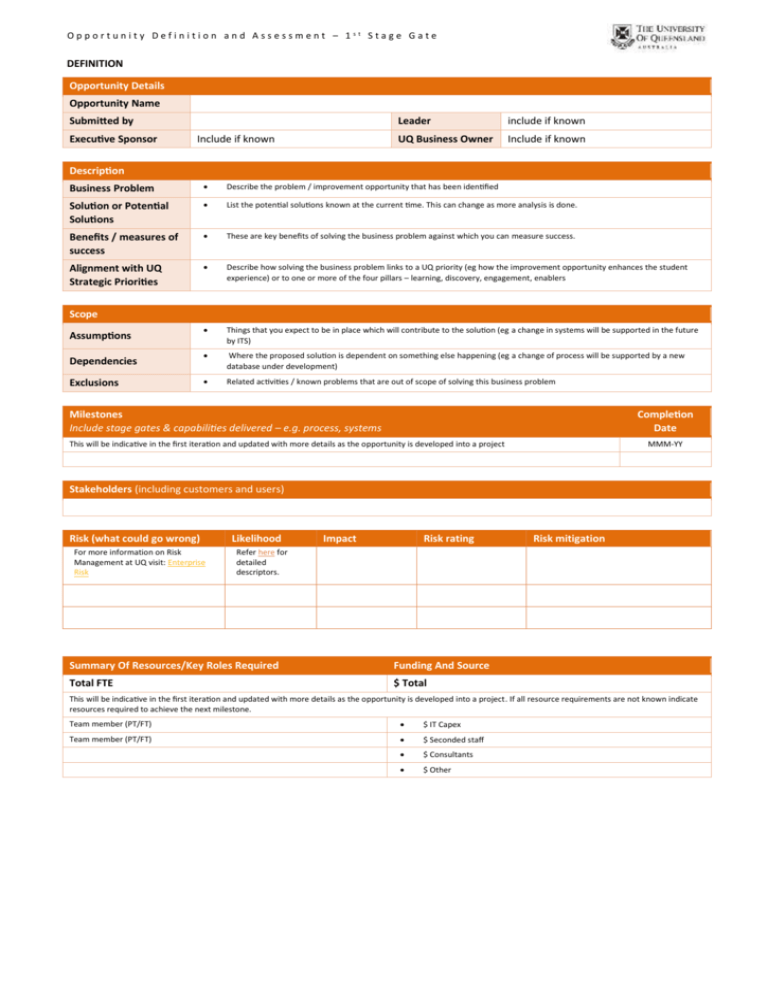
Opportunity Definition and Assessment – 1st Stage Gate DEFINITION Opportunity Details Opportunity Name Submitted by Executive Sponsor Include if known Leader include if known UQ Business Owner Include if known Description Business Problem Describe the problem / improvement opportunity that has been identified Solution or Potential Solutions List the potential solutions known at the current time. This can change as more analysis is done. Benefits / measures of success These are key benefits of solving the business problem against which you can measure success. Alignment with UQ Strategic Priorities Describe how solving the business problem links to a UQ priority (eg how the improvement opportunity enhances the student experience) or to one or more of the four pillars – learning, discovery, engagement, enablers Things that you expect to be in place which will contribute to the solution (eg a change in systems will be supported in the future by ITS) Where the proposed solution is dependent on something else happening (eg a change of process will be supported by a new database under development) Related activities / known problems that are out of scope of solving this business problem Scope Assumptions Dependencies Exclusions Milestones Include stage gates & capabilities delivered – e.g. process, systems Completion Date This will be indicative in the first iteration and updated with more details as the opportunity is developed into a project MMM-YY Stakeholders (including customers and users) Risk (what could go wrong) For more information on Risk Management at UQ visit: Enterprise Risk Likelihood Impact Risk rating Risk mitigation Refer here for detailed descriptors. Summary Of Resources/Key Roles Required Funding And Source Total FTE $ Total This will be indicative in the first iteration and updated with more details as the opportunity is developed into a project. If all resource requirements are not known indicate resources required to achieve the next milestone. Team member (PT/FT) $ IT Capex Team member (PT/FT) $ Seconded staff $ Consultants $ Other Opportunity Definition and Assessment – 1st Stage Gate INITIAL ASSESSMENT Performance Drivers Describe key indicators that define current service delivery and the potential for improvement (these should be critical-to-quality – things that must be done successfully Performance drivers Baseline Opportunity Volume (e.g. # transactions/year; # users impacted) Quantitative measure (eg transactions per month, requests received per month) Current performance Desired improvement where relevant (eg % increase in capacity to perform transactions) Quality (e.g. % complete and accurate; % reworked) Quantitative measure if known or qualitative measure Current performance Desired improvement (eg 20% reduction in error rate) Delivery ( e.g. time to complete process or % complete on time) Quantitative measure of time per instance of delivery or percentage completed within agreed timeframe Current performance Desired improvement Cost (e.g. time spent working on the process) Cost is total time spent on process over a week / month / year. Can be expressed in hours rather than $ if relevant Improvement Options List the possible solutions considered and indicate the preferred option based on current information. This might change as more analysis is done for 2nd stage gate approval. It is not necessary to seek 1st stage gate approval a second time if the preferred solution changes. (indicate which is preferred option) Impact Summary Of Preferred Option (Indication of the impact of solving the business problem) Quality /User Experience Rating These can be indicative at 1st stage gate approval and become more clearly defined for 2nd stage gate approval as an options analysis is undertaken 1st 2nd Savings (time or other) These can be indicative at stage gate approval and become more clearly defined for approval as an options analysis is undertaken Reputation /Compliance These can be indicative at 1st stage gate approval and become more clearly defined for 2nd stage gate approval as an options analysis is undertaken Estimated Effort Required To Achieve The Preferred Option stage gate Details These can be indicative at 1st stage gate approval and become more clearly defined for 2nd stage gate approval as an options analysis is undertaken Time to implement 3 months Resources (person-weeks of effort NOT elapsed time) $ [x-y] years $ IT Investment: Incremental changes to existing systems / new systems / yet to be assessed Estimate Overall Effort Rating (Low= <6 months; Med= <12 months; High= >12 months) LOW / MED / HIGH Processes Have relevant business processes been mapped and reviewed? YES / NO 1st STAGE GATE APPROVAL Approved by [ESS Steering Committee] Approved on [Date] low/med/high low/med/high low/med/high

