Phase 2
advertisement
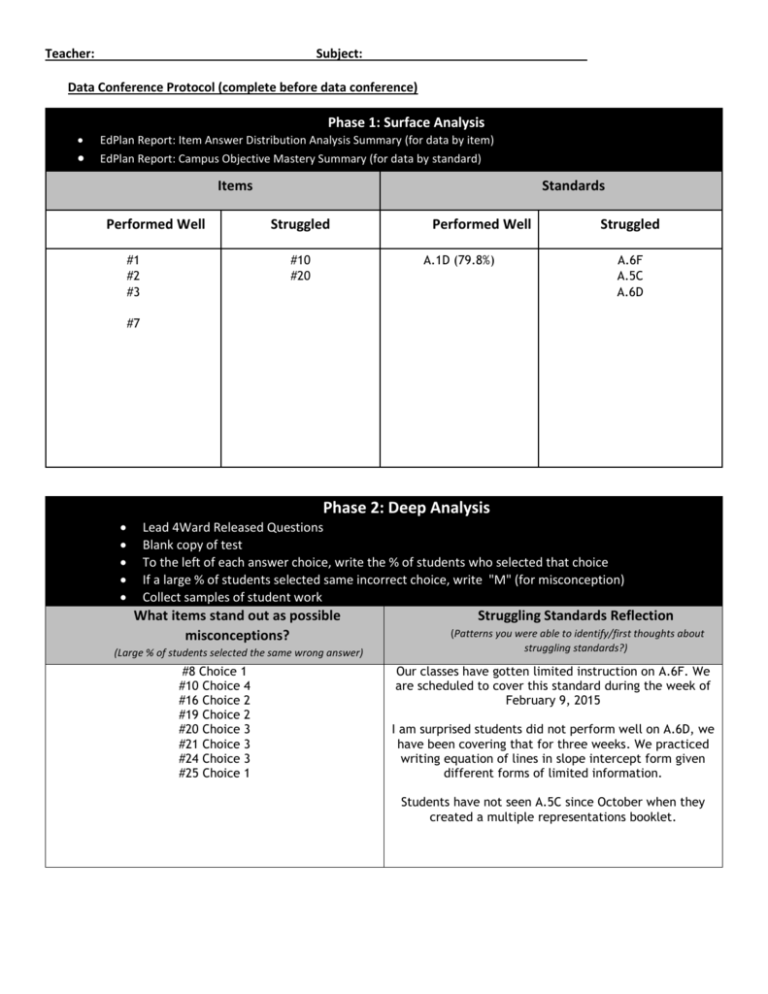
Teacher: Subject: Data Conference Protocol (complete before data conference) Phase 1: Surface Analysis EdPlan Report: Item Answer Distribution Analysis Summary (for data by item) EdPlan Report: Campus Objective Mastery Summary (for data by standard) Items Performed Well #1 #2 #3 Standards Struggled #10 #20 Performed Well A.1D (79.8%) Struggled A.6F A.5C A.6D #7 Phase 2: Deep Analysis Lead 4Ward Released Questions Blank copy of test To the left of each answer choice, write the % of students who selected that choice If a large % of students selected same incorrect choice, write "M" (for misconception) Collect samples of student work What items stand out as possible misconceptions? (Large % of students selected the same wrong answer) #8 Choice 1 #10 Choice 4 #16 Choice 2 #19 Choice 2 #20 Choice 3 #21 Choice 3 #24 Choice 3 #25 Choice 1 Struggling Standards Reflection (Patterns you were able to identify/first thoughts about struggling standards?) Our classes have gotten limited instruction on A.6F. We are scheduled to cover this standard during the week of February 9, 2015 I am surprised students did not perform well on A.6D, we have been covering that for three weeks. We practiced writing equation of lines in slope intercept form given different forms of limited information. Students have not seen A.5C since October when they created a multiple representations booklet. Phase 2 cont'd: Error Analysis Specific Items (Identified in Phase 1 and 2) Within Standard (Identified in Phase 1 and 2) (review student samples/ identified misconceptions) (break down standard/analyze released questions/analyze test questions/analyze student samples/ reflection AFTER deep dive) #10 and #20 were items with lowest performance and misconceptions. #8 Choice 1: The question asks which statement is NOT a reasonable conclusion. The first answer choice is a true statement. Students may have chosen it because it is right and they read it first. #10 Choice 4: Each answer choice statement has to do with "rate of change." There are two tables given and their rate of change is not shown. Most students may have chosen Choice 4 because it is a true statement about the height, according to the first table. #16 Choice 2 Students calculating slope from the graph may not have noticed scale factor of 2 is used. #19 Choice 2 Choice 2 is equation matches original situation presented. Questions asks for equation AFTER receiving a raise. Students may have assumed question is asking about original situation. #20 Choice 3 The rate of change is not shown on the table. Student would have to calculate each rate of change to be able to answer the question. The table shows someone's weight and it changes every week. This may be why students selected rate of change changes every week. #21 Choice 3 If a student calculates cost of one sandwich, Choice 2 (correct answer) and Choice 3 add up to the same amount. #24 Choice 3 Students solving for y did not flip the inequality symbol #25 Choice 1 Students selected answer choice with numbers in the order they are presented in the verbal situation. A.6F-(#19, #20 and #21) interpret and predict the effects of changing slope and y‐intercept in applied situations/ typically a verbal model is presented and something changes. Students must understand meaning of slope and y intercept to be able to write a new equation. Students match new equation to a verbal model or vice versa. We have not practiced these types of questions in class, they were scheduled for the week after DLA window. Students will practice this as we discuss other objectives by stating the meaning of the slope and y - intercept when they see a graph, table or verbal model. I will assess their performance on this standard on February 25. A.5C (#10, #11 and #12) use, translate, and make connections among algebraic, tabular, graphical, or verbal descriptions of linear functions. Students should be able to represent functions different ways identify if different representations are the function or not. Students also need to be able to understand the meaning of equations that represent linear functions. Based on student samples, students, struggle with questions that have verbal models as answer choices. A.6D (#16, #17 and #18) graph and write equations of lines given characteristics such as two points, a point and a slope, or a slope and y‐intercept. Typically students are required to match equation of a line to information given. Students need to practice writing equations that are in slope intercept form in standard form and vice versa. Based on student samples, my students who know how to write the equation of a line in slope intercept form are struggling with rewriting that equation in standard form. Phase 3: Action Plan Confirm scholar misconceptions and generate action plans that will drive improved results Planning Calendar Upcoming Lesson Plans What teaching implications were revealed through your analysis of misconceptions? (Items) What teaching implications were revealed through your analysis of misunderstandings? (Standards) Plan for re-teaching/reviewing misconceptions and misunderstandings (include plan to address scaffolding/enrichment) Timeline and execution plan (include revised/updated planning calendar)
