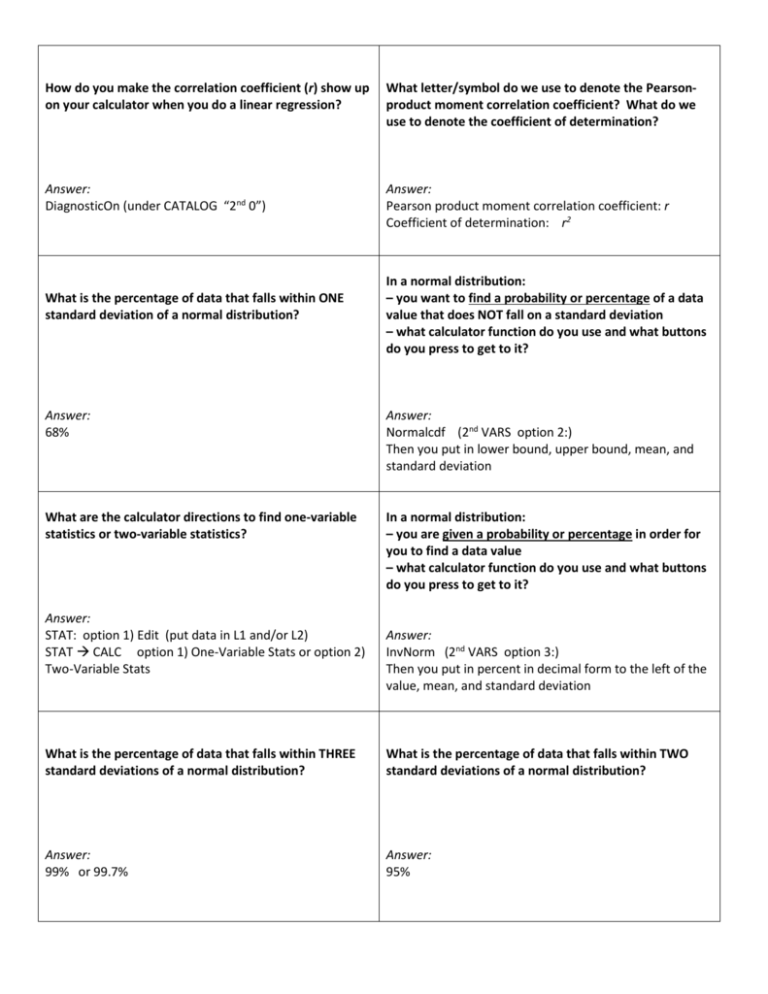
How do you make the correlation coefficient (r) show up on your
advertisement

How do you make the correlation coefficient (r) show up on your calculator when you do a linear regression? What letter/symbol do we use to denote the Pearsonproduct moment correlation coefficient? What do we use to denote the coefficient of determination? Answer: DiagnosticOn (under CATALOG “2nd 0”) Answer: Pearson product moment correlation coefficient: r Coefficient of determination: r2 What is the percentage of data that falls within ONE standard deviation of a normal distribution? In a normal distribution: – you want to find a probability or percentage of a data value that does NOT fall on a standard deviation – what calculator function do you use and what buttons do you press to get to it? Answer: 68% Answer: Normalcdf (2nd VARS option 2:) Then you put in lower bound, upper bound, mean, and standard deviation What are the calculator directions to find one-variable statistics or two-variable statistics? In a normal distribution: – you are given a probability or percentage in order for you to find a data value – what calculator function do you use and what buttons do you press to get to it? Answer: STAT: option 1) Edit (put data in L1 and/or L2) STAT CALC option 1) One-Variable Stats or option 2) Two-Variable Stats Answer: InvNorm (2nd VARS option 3:) Then you put in percent in decimal form to the left of the value, mean, and standard deviation What is the percentage of data that falls within THREE standard deviations of a normal distribution? What is the percentage of data that falls within TWO standard deviations of a normal distribution? Answer: 99% or 99.7% Answer: 95% What is a least squares regression line? Answer: A best-fit line or a linear regression What are the two hypotheses of a Chi-Square Test and what are they supposed to state? Answer: H0 (null) – the variables are independent Ha (alternate) – the two variables are not independent How do you know when to reject H0 using the X2 statistic? Answer: If the X2 is higher than the critical value, you reject H0 What point does a best-fit line aka a linear regression always go through? Answer: The mean of x and the mean of y x, y If you do a regression and get an r2 value of .70, is it a strong, moderate or weak correlation? Answer: Moderate correlation How do you know when to reject H0 using the p-value? Answer: If the p-value is lower than the significance level, you reject H0 How do you find the degrees of freedom? Answer: (#rows – 1)(#columns – 1) If there is a strong, negative linear correlation, what number is the r value close to? Answer: -1 IBMS IBMS Statistical Applications Statistical Applications Review Review IBMS IBMS Statistical Applications Statistical Applications Review Review IBMS IBMS Statistical Applications Statistical Applications Review Review IBMS IBMS Statistical Applications Statistical Applications Review Review


