Non-linear constraints
advertisement
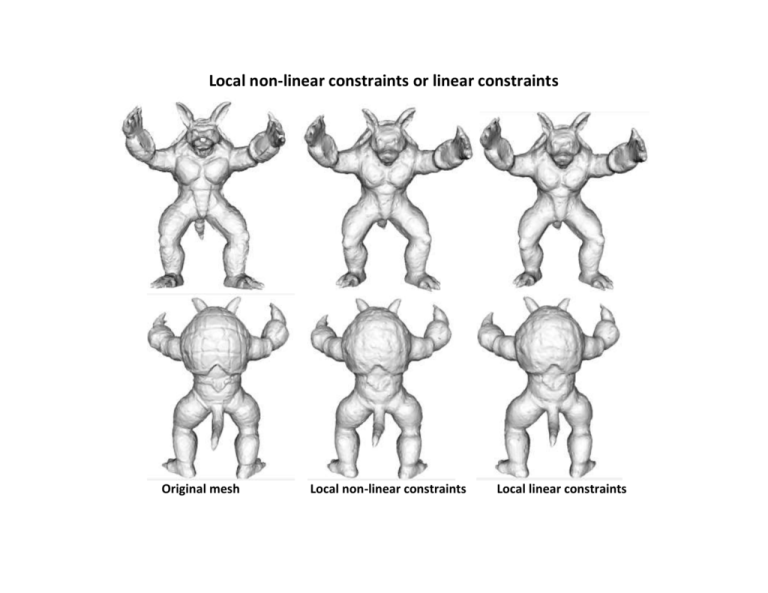
Local non-linear constraints or linear constraints Original mesh Local non-linear constraints Local linear constraints Feasible region: Linear constraints: The intersection of three planes shown in the left of the above figure. Non-linear constraints: The intersection of two planes and the outside of a sphere shown in the right of the above figure. Evaluation: Enlarge the feasible region from linear constraints to the non-linear constraints cannot improve the final results. 1. Time Linear constraints: average 0.04s for each vertex Non-linear constraints: average 0.07s for each vertex 2. Minimized energy at the solutions We give statistics of the energies at the solutions of linear constraints and non-linear constraints for 1000 vertices, only at 292 vertices the non-linear constraints outperform than linear ones. And the mean of the energies are: Linear constraints: 1.537377976513757e-05 Non-linear constraints: 1.400512852788669e-05 3. Closest distances from the result mesh to the original mesh Linear constraints: min : 0.000000 max 0.009392 mean : 0.001154 Non-linear constraints: min : 0.000000 max 0.009006 mean : 0.001161 Conclusion: (Feasible region VS. Minimized energy) 1. Enlarge the feasible region from linear constraints to the non-linear constraints cannot improve the final results. 2. The model of minimized energy is the key of the final result, we should try to improve the minimized energy. 3. Future directions (1) First smooth the non-obtuse mesh, and then deform to fit. (2) Using the vertices of the original mesh to move part vertices of the non-obtuse mesh.
