Chapters 18 and 19 Notes filled in
advertisement
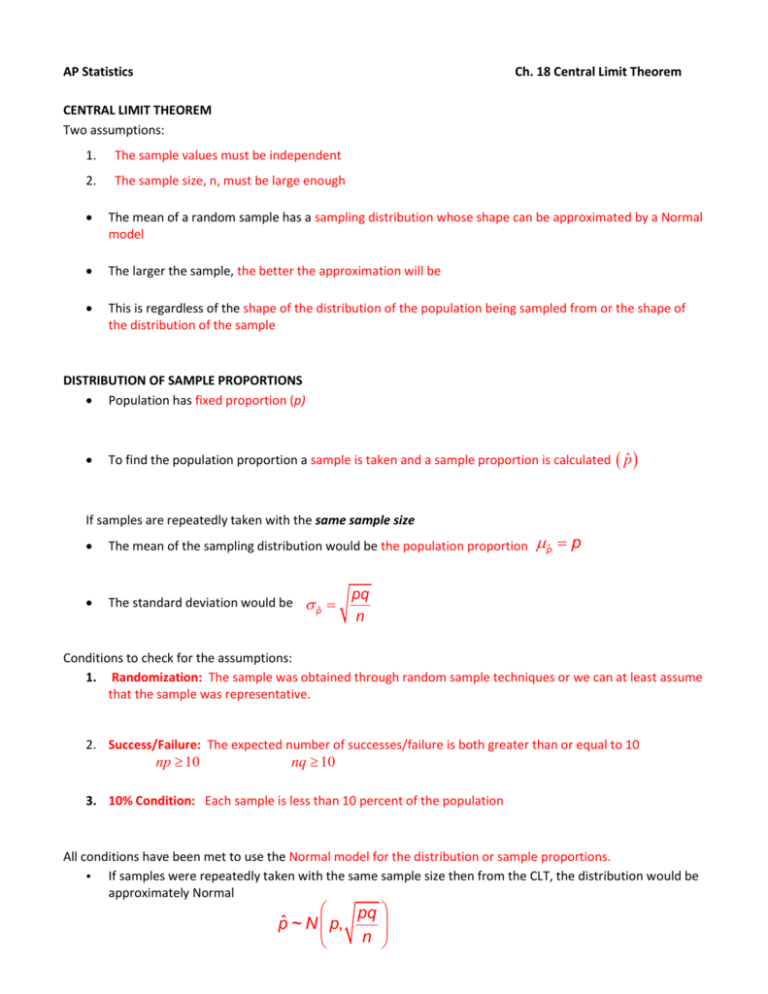
AP Statistics Ch. 18 Central Limit Theorem CENTRAL LIMIT THEOREM Two assumptions: 1. The sample values must be independent 2. The sample size, n, must be large enough The mean of a random sample has a sampling distribution whose shape can be approximated by a Normal model The larger the sample, the better the approximation will be This is regardless of the shape of the distribution of the population being sampled from or the shape of the distribution of the sample DISTRIBUTION OF SAMPLE PROPORTIONS Population has fixed proportion (p) To find the population proportion a sample is taken and a sample proportion is calculated p̂ If samples are repeatedly taken with the same sample size The mean of the sampling distribution would be the population proportion The standard deviation would be p̂ p̂ p pq n Conditions to check for the assumptions: 1. Randomization: The sample was obtained through random sample techniques or we can at least assume that the sample was representative. 2. Success/Failure: The expected number of successes/failure is both greater than or equal to 10 np 10 nq 10 3. 10% Condition: Each sample is less than 10 percent of the population All conditions have been met to use the Normal model for the distribution or sample proportions. • If samples were repeatedly taken with the same sample size then from the CLT, the distribution would be approximately Normal pq pˆ ~ N p, n Example Skittles: • According to the manufacturer of the candy Skittles, 20% of the candy produced is the color red. What is the probability that given a large bag of skittles with 58 candies that we get at least 17 red? n = 58 Conditions: 1. SRS p = .20 q = .80 pˆ 17 58 1. Assumed representative (58)(.20) 10 (58)(.80) 10 2. np & nq 10 2. 3. 10% condition 3. There are more than 580 skittles produced, so we are sampling less than 10% pop 10n All conditions met to use the Normal model Model: p .20 N (.20,.0525) Answer question: pˆ 17 .293 58 P( pˆ .293) .0383 Practice: p. 433 #12, 16 pq (.20)(.80) .0525 n 58 AP STATISTICS Ch. 19: CONFIDENCE INTERVALS: For single sample proportions However, most of the time we don’t know… the population proportion (p) We take samples and calculate _ p̂ _____ in order to try and find __p______ Since we don’t know p, we can’t find … the standard deviation __ p̂ _____ is the estimate for _p______ So… we can estimate the std. deviation with _standard error_____________________________: o SE = ˆˆ pq n CONFIDENCE INTERVALS… The basics: Based on … p̂ and the sampling distribution of p̂ Start with _ p̂ _____ and give ourselves _a margin of error on either side__________ Size of the interval (of the MOE) is based on _sample size_______ and _level of confidence______ o Larger sample size = smaller interval (more accurate) o Larger confidence level = larger (wider) interval (need more room for error) Basic Setup: Estimate MOE Specifically, for 1-proportion sample: pˆ ( Z * )( SE pˆ ) pˆ ( Z * ) ˆˆ pq (a, b) n Z* = critical value _______ % of data is between Z (confidence level) 3 main confidence levels: Level of Confidence 90% 95% 99% 𝑍 ∗ value 1.645 1.960 2.576 Other confidence levels… how do we find Z*? EX: 92% Invnorm(.04, 0 ,1) = 1.751 SENTENCE INTERPRETATION: We are _______% confident that the true % of ______________ is between ___a____ and ____b____ % *must write this sentence every time CONDITIONS: (for 1-Prop Z-Interval) 1. Simple Random Sample (SRS) 2. npˆ & nqˆ 10 *must use p̂ because we don’t know p 3. 10 % condition pop 10n If all conditions are met, then we can say that p̂ has the model: N pˆ , And we can use the Normal Model for the 1-Prop Z-interval ˆˆ pq n Example: We want to know the real improvement rate for a new medication. We conduct an experiment and find that out of 53 subjects, 27% of them report improvement with the new medications. Create a 95% confidence interval (and interpret). n = 53 pˆ .27 qˆ .73 C=95% Conditions: 1. Simple Random Sample (SRS) 2. npˆ & nqˆ 10 3. 10 % condition pop 10n 1. Assumed representative 2. (53)(.27) 10 (53)(.73) 10 3. There are more than 530 people taking medication so we are sampling less than 10% of the population. Conditions met N(.27, .061)1-Prop. Z-Int (.27)(.73) .27 (1.960) 53 .27 .11956 (.15044,.38956) We are 95% confident that the true proportion of people seeing improvement with the new medication is between 15.044% and 38.956%. Example: We take a simple random sample of 95 Bucks county residents and find that only 20 of them approve of a new property tax to pay for repairs to local roads. Estimate with 99% confidence the true percent of people who approve of the tax. n = 95 pˆ 20 95 qˆ 75 95 C=99% Conditions: 1. Simple Random Sample (SRS) 2. npˆ & nqˆ 10 3. 10 % condition pop 10n 1. Stated SRS 20 (95) 10 95 2. 75 (95) 10 95 3. There are more than 900 residents in Bucks County so we are sampling less than 10% of the population. Conditions met N(.211, .0419)1-Prop. Z-Int (.211)(.789) .211 (2.576) 95 (.1031,.3189) We are 99% confident that the true proportion of people who approve of a new property tax to pay for repairs to local roads is between 10.31% and 31.89%. What does ____% confidence mean? Sentence: In repeated samples of size ___n____, the confidence interval created will catch the true __parameter (p)___ __CI____% of the time. For the previous example: In repeated samples of size 95, the confidence interval created will catch the true proportion of those who approve a new property tax to pay for repairs to local roads 99% of the time. MORE ABOUT MARGIN OF ERROR: Things that affect MOE (margin of error): MOE *sample size pˆ ( Z * ) ˆˆ pq n ( a, b) * confidence level If we want a particular MOE, we can set a level of confidence and a sample size in order to attain that MOE. Example: Let's go back to our example about the improvement rate with a new medication. We found 27% improvement. How many subjects would we need in a new experiment to make a 98% conf. interval while still keeping a 5% MOE? MOE ( Z * ) ˆˆ pq n (.27)(.73) .05 (2.326) n .1971 n n 426.392 n 427 people .0215 *always round up! NOTE: If you are not given a value of p̂ , you can use __0.50_________ - It doesn’t favor either outcome (success or failure) it will give you the largest sample size Example: What sample size must be used to estimate the outcome of a political election with a margin of error of 3% and 99% confidence? (.50)(.50) .03 (2.576) n .25 n n 1843.271 n 1844 people .0116 Example: What sample size must be used to estimate the true percent of left-handed people in the nation with 90% confidence and a margin of error of 8%? Assume that it has been shown in previous research that the percent of left-handed people was 38%. (.38)(.62) .08 (1.645) n .2356 n n 99.616 n 100 people .0486


