tpj13041-sup-0018-Legends
advertisement
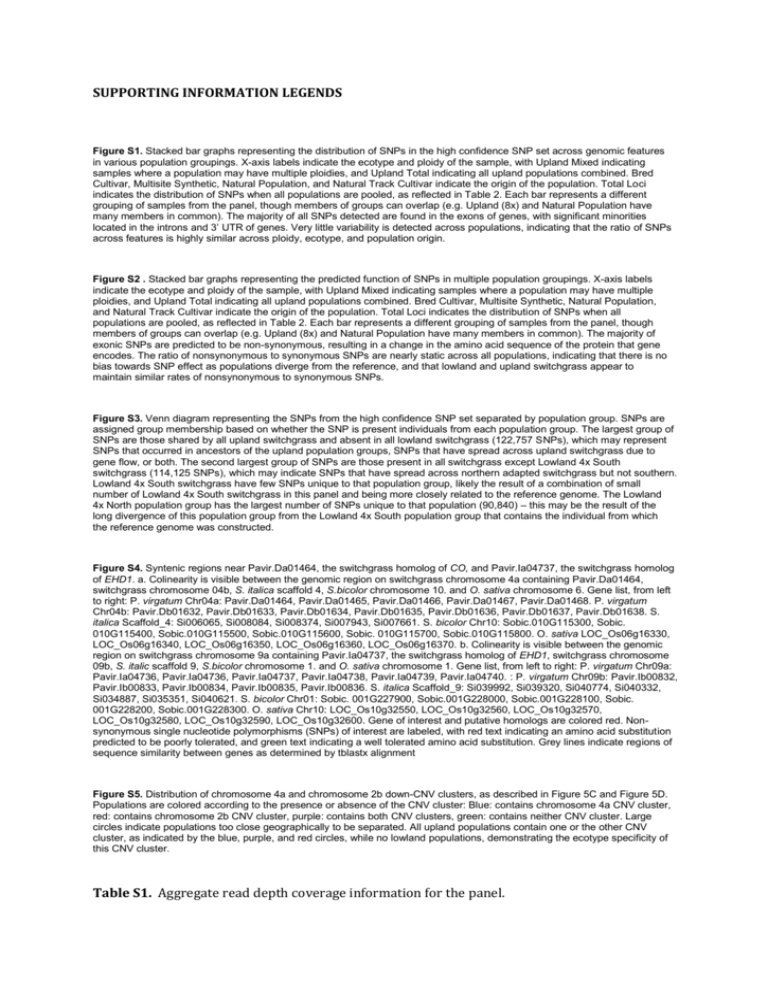
SUPPORTING INFORMATION LEGENDS Figure S1. Stacked bar graphs representing the distribution of SNPs in the high confidence SNP set across genomic features in various population groupings. X-axis labels indicate the ecotype and ploidy of the sample, with Upland Mixed indicating samples where a population may have multiple ploidies, and Upland Total indicating all upland populations combined. Bred Cultivar, Multisite Synthetic, Natural Population, and Natural Track Cultivar indicate the origin of the population. Total Loci indicates the distribution of SNPs when all populations are pooled, as reflected in Table 2. Each bar represents a different grouping of samples from the panel, though members of groups can overlap (e.g. Upland (8x) and Natural Population have many members in common). The majority of all SNPs detected are found in the exons of genes, with significant minorities located in the introns and 3’ UTR of genes. Very little variability is detected across populations, indicating that the ratio of SNPs across features is highly similar across ploidy, ecotype, and population origin. Figure S2 . Stacked bar graphs representing the predicted function of SNPs in multiple population groupings. X-axis labels indicate the ecotype and ploidy of the sample, with Upland Mixed indicating samples where a population may have multiple ploidies, and Upland Total indicating all upland populations combined. Bred Cultivar, Multisite Synthetic, Natural Population, and Natural Track Cultivar indicate the origin of the population. Total Loci indicates the distribution of SNPs when all populations are pooled, as reflected in Table 2. Each bar represents a different grouping of samples from the panel, though members of groups can overlap (e.g. Upland (8x) and Natural Population have many members in common). The majority of exonic SNPs are predicted to be non-synonymous, resulting in a change in the amino acid sequence of the protein that gene encodes. The ratio of nonsynonymous to synonymous SNPs are nearly static across all populations, indicating that there is no bias towards SNP effect as populations diverge from the reference, and that lowland and upland switchgrass appear to maintain similar rates of nonsynonymous to synonymous SNPs. Figure S3. Venn diagram representing the SNPs from the high confidence SNP set separated by population group. SNPs are assigned group membership based on whether the SNP is present individuals from each population group. The largest group of SNPs are those shared by all upland switchgrass and absent in all lowland switchgrass (122,757 SNPs), which may represent SNPs that occurred in ancestors of the upland population groups, SNPs that have spread across upland switchgrass due to gene flow, or both. The second largest group of SNPs are those present in all switchgrass except Lowland 4x South switchgrass (114,125 SNPs), which may indicate SNPs that have spread across northern adapted switchgrass but not southern. Lowland 4x South switchgrass have few SNPs unique to that population group, likely the result of a combination of small number of Lowland 4x South switchgrass in this panel and being more closely related to the reference genome. The Lowland 4x North population group has the largest number of SNPs unique to that population (90,840) – this may be the result of the long divergence of this population group from the Lowland 4x South population group that contains the individual from which the reference genome was constructed. Figure S4. Syntenic regions near Pavir.Da01464, the switchgrass homolog of CO, and Pavir.Ia04737, the switchgrass homolog of EHD1. a. Colinearity is visible between the genomic region on switchgrass chromosome 4a containing Pavir.Da01464, switchgrass chromosome 04b, S. italica scaffold 4, S.bicolor chromosome 10. and O. sativa chromosome 6. Gene list, from left to right: P. virgatum Chr04a: Pavir.Da01464, Pavir.Da01465, Pavir.Da01466, Pavir.Da01467, Pavir.Da01468. P. virgatum Chr04b: Pavir.Db01632, Pavir.Db01633, Pavir.Db01634, Pavir.Db01635, Pavir.Db01636, Pavir.Db01637, Pavir.Db01638. S. italica Scaffold_4: Si006065, Si008084, Si008374, Si007943, Si007661. S. bicolor Chr10: Sobic.010G115300, Sobic. 010G115400, Sobic.010G115500, Sobic.010G115600, Sobic. 010G115700, Sobic.010G115800. O. sativa LOC_Os06g16330, LOC_Os06g16340, LOC_Os06g16350, LOC_Os06g16360, LOC_Os06g16370. b. Colinearity is visible between the genomic region on switchgrass chromosome 9a containing Pavir.Ia04737, the switchgrass homolog of EHD1, switchgrass chromosome 09b, S. italic scaffold 9, S.bicolor chromosome 1. and O. sativa chromosome 1. Gene list, from left to right: P. virgatum Chr09a: Pavir.Ia04736, Pavir.Ia04736, Pavir.Ia04737, Pavir.Ia04738, Pavir.Ia04739, Pavir.Ia04740. : P. virgatum Chr09b: Pavir.Ib00832, Pavir.Ib00833, Pavir.Ib00834, Pavir.Ib00835, Pavir.Ib00836. S. italica Scaffold_9: Si039992, Si039320, Si040774, Si040332, Si034887, Si035351, Si040621. S. bicolor Chr01: Sobic. 001G227900, Sobic.001G228000, Sobic.001G228100, Sobic. 001G228200, Sobic.001G228300. O. sativa Chr10: LOC_Os10g32550, LOC_Os10g32560, LOC_Os10g32570, LOC_Os10g32580, LOC_Os10g32590, LOC_Os10g32600. Gene of interest and putative homologs are colored red. Nonsynonymous single nucleotide polymorphisms (SNPs) of interest are labeled, with red text indicating an amino acid substitution predicted to be poorly tolerated, and green text indicating a well tolerated amino acid substitution. Grey lines indicate regions of sequence similarity between genes as determined by tblastx alignment Figure S5. Distribution of chromosome 4a and chromosome 2b down-CNV clusters, as described in Figure 5C and Figure 5D. Populations are colored according to the presence or absence of the CNV cluster: Blue: contains chromosome 4a CNV cluster, red: contains chromosome 2b CNV cluster, purple: contains both CNV clusters, green: contains neither CNV cluster. Large circles indicate populations too close geographically to be separated. All upland populations contain one or the other CNV cluster, as indicated by the blue, purple, and red circles, while no lowland populations, demonstrating the ecotype specificity of this CNV cluster. Table S1. Aggregate read depth coverage information for the panel. Table S2. Population group membership of switchgrass individuals as determined by STRUCTURE. Table S3. Distribution of copy number variants in switchgrass populations. Table S4. Populations containing the respective copy number variant clusters, and their population group membership and ploidy. Data S1. Number of reads and alignment statistics for switchgrass exome capture populations. All samples Except AP13 were present in Lu et al., 2012. Data S2. Matrix containing allele calls generated for all individuals. Data S3. High resolution searchable version of Figure 4. Data S4. List of copy number variants for all populations. Data S5. Predicted annotations for upland-specific copy number variants. Data S6. Predicted annotations for genes in two upland restricted down-copy number variant clusters. Methods S1. Identification of switchgrass homologs of Constans and Early Heading Date 1. Appendix 1. Workflow and results of comparison of polymorphic sequence from Lu et al., 2013 with polymorphism detected through exome capture sequencing and alignment.
