docx
advertisement
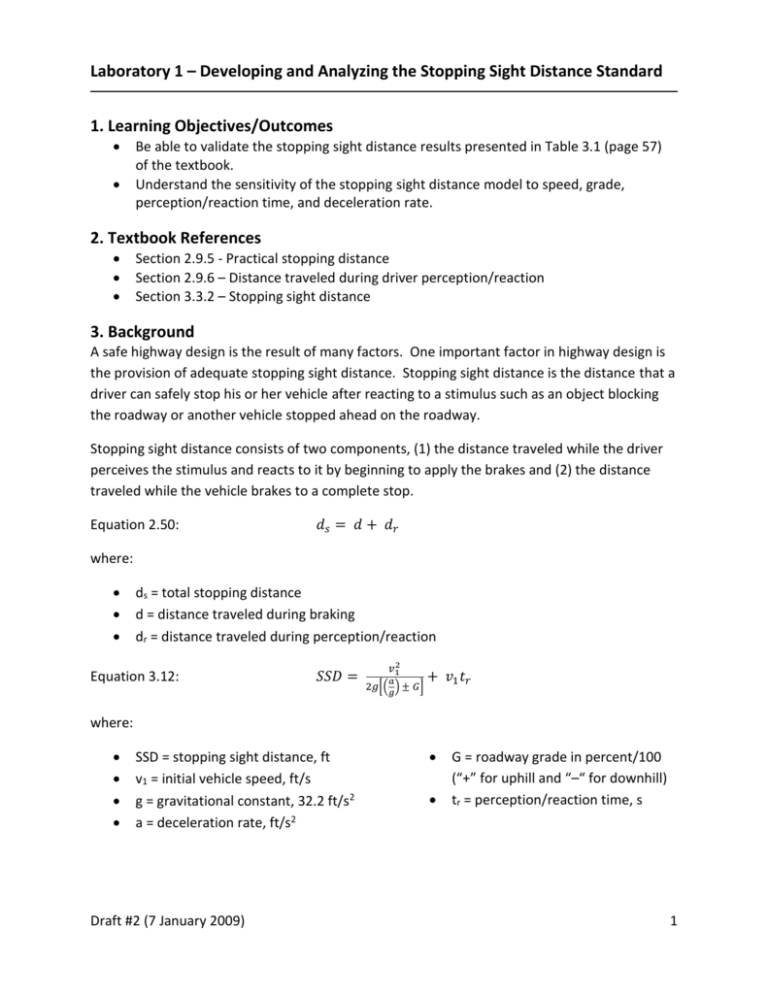
Laboratory 1 – Developing and Analyzing the Stopping Sight Distance Standard 1. Learning Objectives/Outcomes Be able to validate the stopping sight distance results presented in Table 3.1 (page 57) of the textbook. Understand the sensitivity of the stopping sight distance model to speed, grade, perception/reaction time, and deceleration rate. 2. Textbook References Section 2.9.5 - Practical stopping distance Section 2.9.6 – Distance traveled during driver perception/reaction Section 3.3.2 – Stopping sight distance 3. Background A safe highway design is the result of many factors. One important factor in highway design is the provision of adequate stopping sight distance. Stopping sight distance is the distance that a driver can safely stop his or her vehicle after reacting to a stimulus such as an object blocking the roadway or another vehicle stopped ahead on the roadway. Stopping sight distance consists of two components, (1) the distance traveled while the driver perceives the stimulus and reacts to it by beginning to apply the brakes and (2) the distance traveled while the vehicle brakes to a complete stop. Equation 2.50: 𝑑𝑠 = 𝑑 + 𝑑𝑟 where: ds = total stopping distance d = distance traveled during braking dr = distance traveled during perception/reaction Equation 3.12: 𝑆𝑆𝐷 = 𝑣12 𝑎 2𝑔[( ) ± 𝐺] 𝑔 + 𝑣1 𝑡𝑟 where: SSD = stopping sight distance, ft v1 = initial vehicle speed, ft/s g = gravitational constant, 32.2 ft/s2 a = deceleration rate, ft/s2 Draft #2 (7 January 2009) G = roadway grade in percent/100 (“+” for uphill and “–“ for downhill) tr = perception/reaction time, s 1 Laboratory 1 – Developing and Analyzing the Stopping Sight Distance Standard 4. What is a Sensitivity Analysis? One of your tasks in this laboratory is to conduct a sensitivity analysis (see Procedure #1 under Task 2 below). As noted below, a sensitivity analysis of a model allows you to vary each of the model inputs, over a range of reasonable values for that input, one input at a time, so that you can observe the range produced for the output parameter of the model. Following is an example of the analysis of the sensitivity of “distance traveled during perception/reaction” as a function of the perception/reaction time. The base value is 2.5 seconds. Let’s assume that a young driver has a perception/reaction time of 1.0 seconds, while a drunk driver has a perception/reaction time of 4.0 seconds. We will also assume that the initial vehicle speed is 25 miles per hour (or 36.75 ft/sec). The table below shows the distance traveled during perception/reaction for three values of perception/reaction time. The distance is 55.1 feet less for a younger driver (than for the “average” driver), while it is 55.1 feet higher for a drunk driver. While the shorter distance traveled by the younger driver is not a safety issue since it is less than the base case, the distance for a drunk driver is. If the drunk driver saw someone in a cross walk at an intersection and tried to stop, the additional distance that he or she would travel is equivalent to the width of an intersection! P/R time Distance 1.0 36.8 (base case) 2.5 91.9 4.0 147.0 5. Assignment Task 1. Validate and analyze the stopping sight distance standard. Procedure: 1. Table 3-1 (page 57) presents the calculated stopping sight distance for design speeds ranging from 15 miles per hour to 80 miles per hour. Prepare a table (using Excel or MathCAD) to validate the results presented in Table 3-1. Questions to consider: 1. How much of a difference does a change of 10 miles per hour in the speed of vehicles that are using the roadway make in the required stopping sight distance? 2. Why is it important to consider differences in vehicle speed for a given roadway segment? 3. Why is the “design” standard given in Table 3.1 larger than the “calculated” value for each design speed category? Draft #2 (7 January 2009) 2 Laboratory 1 – Developing and Analyzing the Stopping Sight Distance Standard Task 2. Conduct a sensitivity analysis of the stopping sight distance model with respect to speed, grade, perception/reaction time, and deceleration rate. Procedure: 1. A sensitivity analysis of a model allows you to vary each of the model inputs, over a range of reasonable values for that input, one input at a time, so that you can observe the range produced for the output parameter of the model. 2. Using equation 3.12 as your model, conduct a sensitivity analysis of stopping sight distance with respect to four input parameters: speed, grade, perception/reaction time, and deceleration rate. 3. For each of the four input parameters (speed, grade, perception/reaction time, and deceleration rate), select and justify the range in these parameters that you think is the most appropriate for use in your sensitivity analysis. 4. Using Excel or MathCAD, prepare four charts, each showing stopping sight distance as a function of speed, grade, perception/reaction time, or deceleration rate for the ranges that you have selected. When a parameter value is constant (not varied through a range), assume a base design speed of 50 miles per hour, and base values of 11.2 feet/s2 for the deceleration rate, 2.5 s for the perception/reaction time, and zero for the grade. Questions to consider: 1. Briefly justify the ranges of the four parameters that you used in your sensitivity analysis. 2. Which of the four parameters has the most significant effect on stopping sight distance? 3. How might the results from your sensitivity analysis improve your ability to use the stopping sight distance model? Task 3. Prepare a summary report. Prepare a two page report in which you summarize your answers to the questions that you considered during this laboratory. The report should include the following sections: 1. Laboratory title. 2. Names of the authors of the report. 3. Date that the report was completed. 4. Answers to the following questions. a. How much of a difference does a change of 10 miles per hour in the speed of vehicles that are using the roadway make in the required stopping sight distance? b. Why is it important to consider differences in vehicle speed for a given roadway segment? c. Why is the “design” standard given in Table 3.1 larger than the “calculated” value for each design speed category? Draft #2 (7 January 2009) 3 Laboratory 1 – Developing and Analyzing the Stopping Sight Distance Standard d. Briefly justify the ranges of the four parameters that you used in your sensitivity analysis. e. Which of the four parameters has the most significant effect on stopping sight distance? f. How might the results from your sensitivity analysis improve your ability to use the stopping sight distance model? 5. One paragraph describing the main points that you learned from this laboratory. Draft #2 (7 January 2009) 4
