Unpacking Outcomes - North East School Division
advertisement
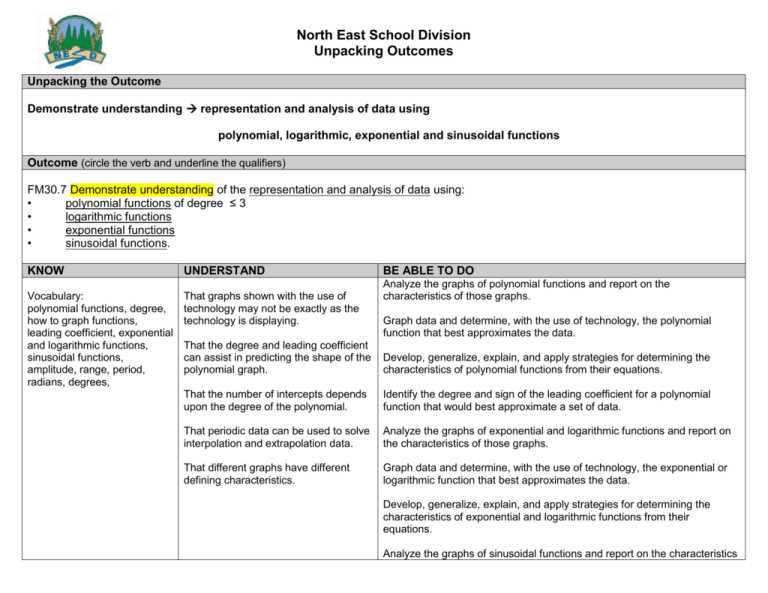
North East School Division Unpacking Outcomes Unpacking the Outcome Demonstrate understanding representation and analysis of data using polynomial, logarithmic, exponential and sinusoidal functions Outcome (circle the verb and underline the qualifiers) FM30.7 Demonstrate understanding of the representation and analysis of data using: • polynomial functions of degree ≤ 3 • logarithmic functions • exponential functions • sinusoidal functions. KNOW UNDERSTAND Vocabulary: polynomial functions, degree, how to graph functions, leading coefficient, exponential and logarithmic functions, sinusoidal functions, amplitude, range, period, radians, degrees, That graphs shown with the use of technology may not be exactly as the technology is displaying. BE ABLE TO DO Analyze the graphs of polynomial functions and report on the characteristics of those graphs. Graph data and determine, with the use of technology, the polynomial function that best approximates the data. That the degree and leading coefficient can assist in predicting the shape of the polynomial graph. Develop, generalize, explain, and apply strategies for determining the characteristics of polynomial functions from their equations. That the number of intercepts depends upon the degree of the polynomial. Identify the degree and sign of the leading coefficient for a polynomial function that would best approximate a set of data. That periodic data can be used to solve interpolation and extrapolation data. Analyze the graphs of exponential and logarithmic functions and report on the characteristics of those graphs. That different graphs have different defining characteristics. Graph data and determine, with the use of technology, the exponential or logarithmic function that best approximates the data. Develop, generalize, explain, and apply strategies for determining the characteristics of exponential and logarithmic functions from their equations. Analyze the graphs of sinusoidal functions and report on the characteristics of those graphs. Graph data and determine, with the use of technology, the sinusoidal function that best approximates the data. Develop, generalize, explain, and apply strategies for determining the characteristics of sinusoidal functions from their equations. Match equations of polynomial, logarithmic, exponential, and sinusoidal functions to their corresponding graphs. Interpret graphs of polynomial, logarithmic, exponential, and sinusoidal functions to describe the situations that each function models and explain the reasoning. Solve, using technology, situational questions that involve data that is best represented by graphs of polynomial, exponential, logarithmic, or sinusoidal functions and explain the reasoning. ESSENTIAL QUESTIONS How can you tell if an equation or a graph represents a polynomial function? How does the end behavior of a function relate to its range? How many intercepts will a polynomial function have? Which parts of a polynomial function are most important for describing its graph? What characteristics do the graphs of all polynomial functions share? Sinusoidal functions? What does the leading coefficient tell us? How can we tell if a function is exponential? What are the key characteristics of an exponential equation? Logarithmic equation? How can you tell if the points on a scatter plot can be modeled by logarithmic function? Exponential function? How can you determine the amplitude, range, period of a sinusoidal function from its graph?

