Municipal Carbon Footprint Report
advertisement
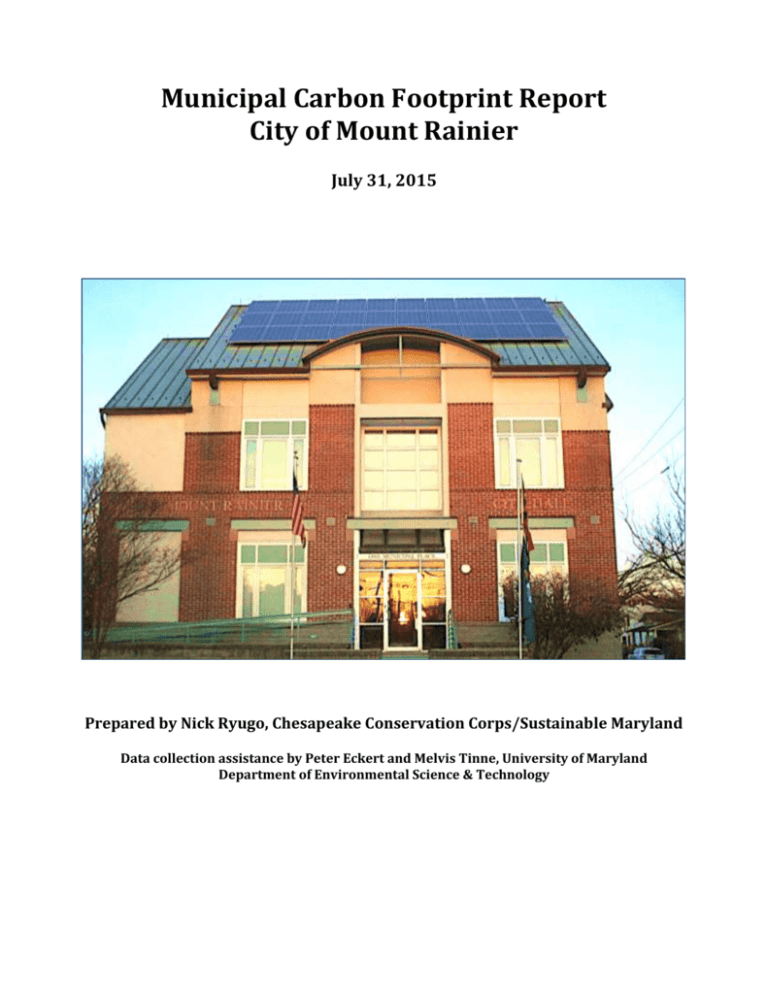
Municipal Carbon Footprint Report City of Mount Rainier July 31, 2015 Prepared by Nick Ryugo, Chesapeake Conservation Corps/Sustainable Maryland Data collection assistance by Peter Eckert and Melvis Tinne, University of Maryland Department of Environmental Science & Technology Statement: Environmental footprint analyses are used to aggregate the human demand from certain ecosystem services required to support the present levels of consumption by individuals, products or populations. The purpose of this particular footprint analysis was to create a basic understanding of how the City of Mount Rainier uses its energy resources, the subsequent emission generation from these resources and to offer simple and cost effective recommendations to minimize the stress on the environment and maximize economic benefits to the city. Procedures/Timeline: In December of 2014, representatives from the Sustainable Maryland (SM) program met with a group of University of Maryland Environmental Science and Technology seniors to partner on creating a municipal carbon footprint for the City of Mount Rainier. In early February 2015, the students and SM staff met with the Mount Rainier Green Team in order to make introductions, present the initial timeline and go over the overall expectations of the project. In the weeks following, the City purchased ClearPath™, an all-inone suite of online tools to complete greenhouse gas inventories, forecasts, and climate action plans. The cost of this membership was $600, of which the City leveraged $500 of UMD student project funds and matched $100 of City funds. The students communicated with the municipal finance department staff in order to compile the requisite energy bills to begin the carbon footprint. SM staff and the UMD students held bi-weekly meetings in order to keep them on track with the project as well as to sort out any issues or questions they might have. It took over a month to finally secure the municipal tracking ClearPath™ software as well as a couple additional months to finally compile all of the information relating to electricity usage, natural gas consumption and vehicle fleet fuel economy data from the City. The students presented their work to the ENST department on May 13, 2015 while Sustainable Maryland representatives completed the report and finalized finishing touches on the project. Findings: Having taken inventory of CO2e emissions from municipally-owned buildings, streetlights, vehicle fuel usage and solid waste facility by aggregating municipal bills for the , we created a rough snapshot of what Mount Rainier’s carbon footprint during the June 2013June 2014 period. The findings include: Solid Waste: 43% of Mount Rainier’s CO2e emissions (~540 metric tons) were generated by the residential solid waste facility, which is responsible for disposing of the ~1,900 tons of solid waste. The content break down looks to be about ~240 tons of organic yard waste, ~340 tons of recyclable material, and ~1,250 tons of other solid waste. Electricity: 14% of CO2e emissions (~172 metric tons) were generated directly from electric kWh usage, with the police station responsible for ~80 tons (46%), representing a clear majority in the building category. Natural Gas: 2% of CO2e emissions (~26.5 metric tons) were generated by natural gas usage. Only the public works building, Star Potts building and the public library utilize natural gas for heating. Streetlights: 19% of CO2e emissions (~226 metric tons) were generated the streetlights in Mount Rainier, which are co-owned between Pepco and the City. Vehicle Fleet: 22% of CO2e emissions (~266 metric tons) were generated by the Mount Rainier vehicle fleet, which consumed ~22,430 gallons of gasoline and ~6,715 gallons of diesel fuel in 2013-2014. Summary: The City of Mount Rainier emitted ~1,202.5 metric tons of carbon/carbon equivalent emissions into the atmosphere from its waste facility, fuel usage and electricity (kWh) and natural gas (Btu) consumption in 2013-2014. Recommendations: 1. Energy Efficiency a. The “lowest hanging fruit” that Mount Rainier could target in order to see economic and environmental savings would be to retrofit its municipal operations buildings with LED lighting fixtures. LED lights can last up to 25x longer than the standard incandescent bulb, according to the US Department of Energy and likewise offer a warranty, ensuring product quality. Furthermore, EnergyStar states that LED lights use a fraction of the required energy (~1/6) in comparison to incandescent light fixtures, while generating equal or greater quantities of light output (lumens). The greatest deterrent in exploring LED lighting is the high upfront cost per bulb, which is mitigated by the savings in kilowatt-hours and reduced necessity to replace bulbs. In general, the goal for Mount Rainier is to take inventory of its consumption of electricity in order to maximize energy efficiency in its buildings. b. The next energy efficiency recommendation is to purchase its ~695 streetlights from Pepco in order to retrofit them with LED lighting fixtures. When applying the information from the Department of Energy and Energy Star to Mount Rainier in 2013-2014, the building inventory energy usage would have gone from 377,937 kWh (actual) to ~62,989.5 kWh, while the streetlight inventory would go from ~493,877 kWh to ~82,312 kWh if a total LED lighting retrofit had taken place. 2. Municipal Fuel Efficiency a. The third recommendation is to strategically upgrade the municipal fleet. The reason for this is because, as stated earlier, the fleet, which is made up of a mix of 34 vehicles, consumed ~22,430 gallons of gasoline and ~6,715 gallons of diesel fuel over the course of the year. This fuel consumption generated a total of 231,852 miles driven by municipal vehicles during this year. This amounts to a fleet-wide average of 7.955 miles per gallon of fuel. Given the relatively small size (.65 square miles) of the City, it makes sense to utilize vehicles that are less costly to operate in a compact urban setting, whether that might be using hybrid or fully electric vehicles. 3. Solid Waste Reductions a. The fourth recommendation is to increase the recycling tonnage in the City. This includes increasing the per household tonnage and increasing the number of households recycling. In 2013-2014 the City generated ~340 tons of recycling making up nearly 20% of the City’s total waste. Diverting more recyclable items from solid waste into recycling could save the City in tipping fees and mitigate some of the 96 tons of carbon equivalent emissions from recycling processes. b. The final recommendation is to continue expanding the municipal composting program in the city from ~10% of households that currently utilize the Mount Rainier backyard composting program. According to the EPA, almost 30% of landfilled solid waste is composed of compostable materials such as food scraps (14.5%) and yard trimmings (13.5%). Tailored to fit Mount Rainier, this means that in addition to the ~240 tons of yard waste and a hypothesized ~250 tons of food waste, Mount Rainier could have avoided an additional ~177.6 tons of dumping fees and garbage truck transportation costs. Graphs and Tables Note: 2013-2014 City Government Emissions, by Municipal Operation CO2e emissions totaled 1230.5 mTons in 2013-2014 Note: kWh Usage Breakdown by Municipal Building Note: Only 3 buildings using natural gas for its municipal processes
