Gippsland Regional overview Gippsland is located in the south east
advertisement
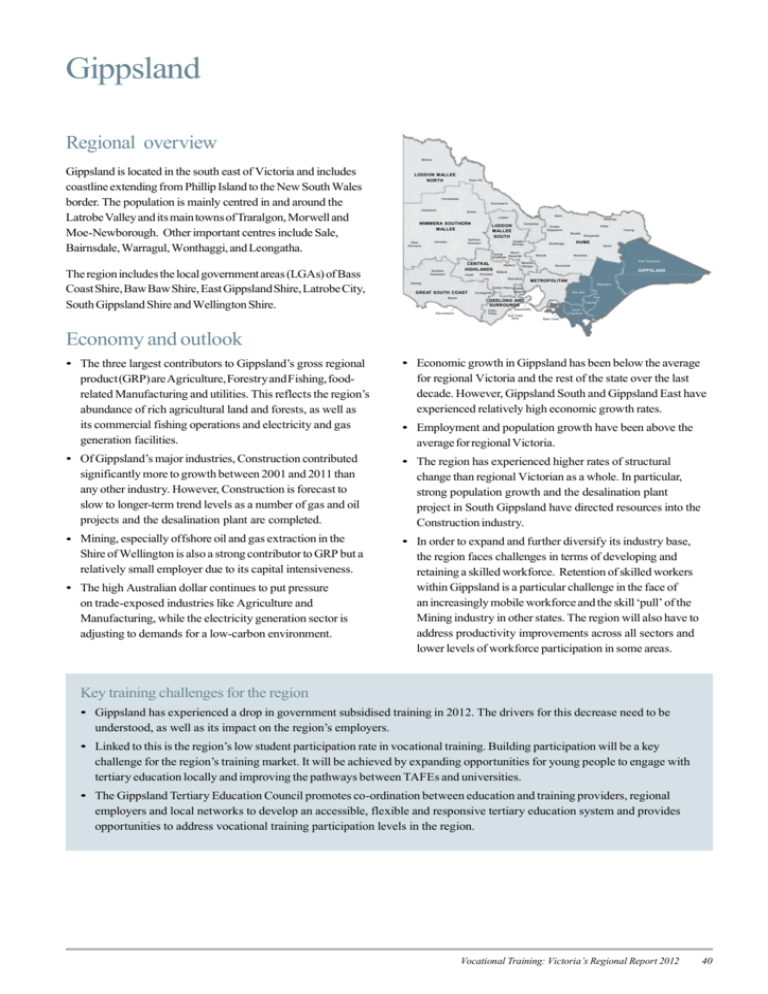
Gippsland Regional overview Mildura Gippsland is located in the south east of Victoria and includes coastline extending from Phillip Island to the New South Wales border. The population is mainly centred in and around the Latrobe Valley and its main towns of Traralgon, Morwell and Moe-Newborough. Other important centres include Sale, Bairnsdale, Warragul, Wonthaggi, and Leongatha. The region includes the local government areas (LGAs) of Bass Coast Shire, Baw Baw Shire, East Gippsland Shire, Latrobe City, South Gippsland Shire and Wellington Shire. LODDON MALLEE NORTH Swan Hill Yarriambiack Gunnawarra Hindmarsh Buloke Moira Loddon WIMMERA SOUTHERN MALLEE West Wimmera Northern Wimmera Horsham Wodonga Campaspe LODDON MALLEE SOUTH Ararat Pyrenees Hepburn Alpine Mansfield Mitchell Macedon Ranges Wangaratta HUME Strathbogie Mount Central Alexander Goldfields Southern Grampians Towong Benalla Greater Bendigo CENTRAL HIGHLANDS Indigo Greater Shepparton East Gippsland Murrindindi GIPPSLAND Ballarat Moorabool Glenelg METROPOLITAN Wellington GREAT SOUTH COAST Moyne Warrnambool Corangamite Golden Plains Greater Geelong Baw Baw GEELONG AND SURROUNDS ColacOtway Latrobe Queenscliffe Surf Coast Shire South Gippsland Bass Coast Economy and outlook • The three largest contributors to Gippsland’s gross regional product (GRP) are Agriculture, Forestry and Fishing, foodrelated Manufacturing and utilities. This reflects the region’s abundance of rich agricultural land and forests, as well as its commercial fishing operations and electricity and gas generation facilities. • Economic growth in Gippsland has been below the average for regional Victoria and the rest of the state over the last decade. However, Gippsland South and Gippsland East have experienced relatively high economic growth rates. • Of Gippsland’s major industries, Construction contributed significantly more to growth between 2001 and 2011 than any other industry. However, Construction is forecast to slow to longer-term trend levels as a number of gas and oil projects and the desalination plant are completed. • The region has experienced higher rates of structural change than regional Victorian as a whole. In particular, strong population growth and the desalination plant project in South Gippsland have directed resources into the Construction industry. • Mining, especially offshore oil and gas extraction in the Shire of Wellington is also a strong contributor to GRP but a relatively small employer due to its capital intensiveness. • In order to expand and further diversify its industry base, the region faces challenges in terms of developing and retaining a skilled workforce. Retention of skilled workers within Gippsland is a particular challenge in the face of an increasingly mobile workforce and the skill ‘pull’ of the Mining industry in other states. The region will also have to address productivity improvements across all sectors and lower levels of workforce participation in some areas. • The high Australian dollar continues to put pressure on trade-exposed industries like Agriculture and Manufacturing, while the electricity generation sector is adjusting to demands for a low-carbon environment. • Employment and population growth have been above the average for regional Victoria. Key training challenges for the region • Gippsland has experienced a drop in government subsidised training in 2012. The drivers for this decrease need to be understood, as well as its impact on the region’s employers. • Linked to this is the region’s low student participation rate in vocational training. Building participation will be a key challenge for the region’s training market. It will be achieved by expanding opportunities for young people to engage with tertiary education locally and improving the pathways between TAFEs and universities. • The Gippsland Tertiary Education Council promotes co-ordination between education and training providers, regional employers and local networks to develop an accessible, flexible and responsive tertiary education system and provides opportunities to address vocational training participation levels in the region. Vocational Training: Victoria’s Regional Report 2012 40 Figure 1: Key indicators Key indicators 2011 Figure 2: Regional training dashboard 2012 vs. 2011 Gippsland Regional Victoria Victoria GRP growth 2001-11 2.0% 2.2% 3.5% Employment growth 2001-11 0.7% 0.6% 1.0% Population growth 2001-11 0.8% 0.7% 1.4% Unemployment rate 5.7% 5.1% 5.4% Labour force participation rate 56.0% 58.5% 61.4% Government funded enrolments TAFE FFS enrolments • Gippsland declined in enrolments over the year by 7 per cent. This was offset, however, by growth in TAFE fee for service enrolments of 10 per cent. • TAFEs accounted for 64 per cent of all enrolments in the region in 2012. -3% 9,500 26,200 13,900 Hours 11% 4.9 million -20% 10,700 TAFE Privat e 68% 4,000 2,000 -7% AC E Apprentices/ trainees • The fall in enrolments was largely driven by declines in Certificate I in Work Education, Certificate I in Vocational Preparation and Certificate II in Building and Construction. • 101 providers delivered government subsidised training in the region in 2012, up from 81 in 2011. This was by an increase in the number of private providers, and Gippsland had the largest growth in enrolments with private providers of all the regions (68 per cent). -1% Students Enrolments by provider type • There were 16,700 government subsidised vocational training enrolments in Gippsland in 2012. There was 9,500 fee for service enrolments at TAFE providers. 10% Total enrolments (GF + TAFE FFS) Growth figures represent annual average growth rate 2001-2011 Source: RDV, ABS Census 2011 Regional training delivery1 16,700 -7% 3% 4,300 Note: size of bars represents % growth 2011-12 Figure 3: Regional training comparison Gippsland 2008 2009 2010 2011 2012 17,400 16,300 18,500 17,900 16,700 Year-on-year % change – -6% 13% -3% -7% % change across Victoria – 2% 17% 35% 25% • However, while the enrolments share of private providers almost doubled between 2011 and 2012 (up by 11 percentage points to 24 per cent), it is under the average for regional Victoria (33 per cent). • The Bass Coast LGA experienced the largest increase in enrolments in 2012, while the region’s training activity is concentrated in the Latrobe LGA, accounting for 36 per cent of enrolments. 1 41 Scope of data is nationally accredited and recognised training at AQF level 1 and above. Commentary refers to government subsidised activity unless otherwise stated. Vocational Training: Victoria’s Regional Report 2012 Figure 4: Vocational training provider trends Number of providers 2012 Provider share 2012 (% change since 2011) (change in percentage points since 2011) 65 64% 32 24% 12% 4 44% TAFE Private -10% 11% TAFE Private ACE ACE Figure 5: Training delivery by LGA Local Government Area Enrolments 2012 % change 2011-2012 Number of providers 2012 % change 2011-2012 Student participation rate % Bass Coast (S) 1,600 75% 15 15% 11% Baw Baw (S) 2,200 10% 18 38% 10% East Gippsland (S) 2,800 -20% 22 47% 13% Latrobe (C) 6,000 2% 44 38% 13% South Gippsland (S) 1,600 24% 16 45% 12% Wellington (S) 2,600 -40% 17 31% 11% Figure 6: Enrolments by funding band2 2012 18% 2011 23% A 2 40% 23% 40% B C 6% 20% D 12% 5% 11% E • In 2012, 18 per cent of government subsidised enrolments in the Gippsland region were aligned to funding band A, and 40 per cent aligned against band B. • Data for enrolments in 2011 are shown aligned against funding bands for the 2011 calendar year for comparison purposes only. • Between 2011 and 2012, there has been an increase in enrolments against band C courses, a reduction in band A courses, and a broadly similar picture across band B, D and E courses. These bands were introduced in 2012 and apply specifically to qualifications current in 2012 and later. In order to allow comparison with previous years, superseded courses have been assigned a subsidy band for analysis purposes based on the band of the current course to which they most closely align. Vocational Training: Victoria’s Regional Report 2012 42 Industry profile Figure 7: Industry share of employment and vocational training • The top three employing industries in the region, Health Care and Social Assistance, Retail Trade and Construction, account for 34 per cent of employment in Gippsland. Vocational training aligned to these industries accounts for 49 per cent of enrolments, indicating alignment between regional training delivery and Gippsland’s changing labour market. • Health Care and Social Assistance is the largest industry in terms of training delivery. It has also seen the highest enrolment growth in 2012, with enrolments increasing by 24 per cent (600 enrolments). • Strong growth in Construction training seen in recent years has begun to slow, with enrolments down by 9 per cent (or 250 enrolments). This is in line with anticipated slowdown in Construction growth to longer-term trend levels as a number of gas and oil projects and the desalination plant are completed. • Enrolments in Arts and Recreation Services have seen the greatest decline in 2012, down by 30 per cent (approximately 350 enrolments). Employment 2011 (% total) Enrolments 2012 (% total) 13% 12% Health Care and Social Assistance 12% 11% Retail Trade 9% Construction 9% 9% 9% 11% 7% Accommodation and Food Services 6% 6% 3% 5% 3% 1% 2% Administrative and Support Services Arts and Recreation Services Mining 0% Rental, Hiring and Real Estate Information Media and Telecoms Gippsland 43 10% 7% 11% 1% 2% 7% 5% 1% 3% 6% 9% Wholesale Trade 0% 0% Electricity, Gas, Water and Waste 0% 0% 3% Administrative and Support Services 3% 2% Financial and Insurance Services 7% Transport, Postal and Warehousing 5% Wholesale Trade Electricity, Gas, Water and Waste Professional, Scientific and Technical 8% 3% Transport, Postal and Warehousing 7% 2% Other Services 4% Professional, Scientific and Technical 4% 2% Manufacturing Public Administration and Safety 4% 4% Other Services 18% 13% Accommodation and Food Services 6% Public Administration and Safety 9% Agriculture, Forestry and Fishing 2% Manufacturing Retail Trade Education and Training 8% Agriculture, Forestry and Fishing 19% 7% Construction 8% Education and Training 24% Health Care and Social Assistance Financial and Insurance Services 4% 1% 5% 0% 2% 6% 6% Arts and Recreation Services 2% 1% 1% 1% Rental, Hiring and Real Estate 0% 1% Information Media and Telecoms 0% 1% 1% 2% Victoria Gippsland Source: ABS Census 2011 Vocational Training: Victoria’s Regional Report 2012 Victoria Figure 9: Qualification trends – workforce and vocational training Figure 8: Occupation share of vocational training (top 10) Enrolments 2012 (% total) 3% 5% Office Manager 8% Child Care Worker Cert I-II 5% Cert III-IV 3% General Clerk 4% 3% Carpenter 2% 43% No non-school qualifications 5% 5% 4% Sales Assistant 38% 2% 1% Diploma + 28% 20% 10% 11% 18% Higher education 30% 3% Teachers' Aide 0% Forestry Worker 0% 2% 2% Enrolled Nurse Mixed Crop and Livestock Farmer Workforce qualifications 6% Aged or Disabled Carer 1% Gippsland Victoria Source: ABS Census 2011 2% 0% Gippsland Victoria • Key training occupations in the Gippsland region are well aligned with the main industry employers, with 8 out of the top 10 occupations of enrolment aligned to the region’s top 5 employing industries. • Enrolments aligned to the occupation Aged or Disabled Carer account for the highest proportion of training in the region, positioning the region well to deliver the services needed by its population into the future. • Enrolments in courses associated with Forestry Workers and Mixed Crop and Livestock Farmers also account for an above average proportion of the training market in Gippsland, highlighting the continuing importance of the Agriculture, Forestry and Fishing industry as a regional employer. Top qualifications 2012 Certificate III In Children's Services 576 Certificate III in General Education for Adults 526 Certificate III in Aged Care 499 Certificate I In General Education For Adults 414 Diploma of Management 360 These 5 courses accounted for 14% of all government funded training in the region. Qualification level 2012 (% change since 2011) 11,300 Qualification profile • Gippsland has lower levels of educational attainment than Victoria as a whole. 43 per cent of the workforce has no postschool qualifications compared to an average of 38 per cent across Victoria. • However, vocational training enrolments in Gippsland are at relatively high qualification levels. Compared to the rest of regional Victoria, Gippsland has the lowest proportion of enrolments in Certificate I-II (18 per cent), the highest proportion of vocational training enrolments in Certificate III-IV (68 per cent), and an above average proportion of enrolments in Diplomas and above (14 per cent). 3,100 2,300 -52% 18% 20% Cert I-II Cert III-IV Diploma & Above • Over the last five years, enrolments in Gippsland have become increasingly focused in higher level vocational training qualifications (excluding higher education). By qualification level, the strongest growth in percentage terms was in Diploma level and above enrolments, followed by the Certificate III-IV level. Only enrolments at Certificate I-II level have fallen. This trend will continue to help the workforce to operate successfully in a more competitive and diversified economy. Vocational Training: Victoria’s Regional Report 2012 44 • Figure 10 highlights vocational training participation among different cohorts, comparing working age vocational training students resident in Gippsland with the region’s working age resident population. Figures referred to in earlier charts and tables in this section relate to enrolments in the region by students that may or may not be resident in the region. Student profile Figure 10: Working age participation3 Working age students and population (% total) CALD 4% 4% Disabled (see footnote) 4% Indigenous 9% 2% 1% 49% 51% Female Unemployed (see footnote) Youth (15-19) 19% 4% 28% 11% 18% Mature age (45+) Students 45% Population • The level of vocational training engagement of higher need learners in Gippsland is consistent with the average for regional Victoria, and largely consistent with the population shares of higher need persons. • On the upside, the share of working-age resident students who were disabled, Indigenous, unemployed or 15–19 years old, exceeded the share of these groups in the general population. Source (popn data): ABS Census 2011 Case Study – Developing stronger connections between industry and training Region: Gippsland The problem • The consultations undertaken during the development of the Gippsland Tertiary Education Plan in 2011 identified a need for Gippsland’s tertiary education provision to be more responsive to the significant economic and demographic changes in the region. The response • The Gippsland Tertiary Education Council (the Council) was formed in 2012 to lead the alignment of tertiary education provision to industry needs, and to help influence educational participation and attainment in the region. The Council is comprised of individuals with expertise and knowledge of Gippsland’s community, industry and education providers. It conducted its first open forum with Gippsland industry in January 2013 and is currently finalising its strategic plan. • The Gippsland Regional Market Facilitation Manager functions as the Secretariat for Council, and also works to ensure that it is well connected to the supports, programs and people in Gippsland that are integral to its success. The outcome • The Council will support a series of strategic collaborative projects that will see training providers and industry working together to build a strong, flexible and responsive local tertiary sector. These projects will facilitate strong relationships between tertiary education providers and employers to ensure that education and training delivers positive employment and productivity outcomes for Gippsland. 3 45 Note: disabled students appear disproportionally high due to different definitions of disability in use by the Australian Bureau of Statistics and the Victorian VET Student Statistical Collection. Data for unemployed residents is restricted to the working age population and factors in those not in the labour force and therefore does not match the regional unemployment rate in Figure 1. Vocational Training: Victoria’s Regional Report 2012 Northern Metropolitan Regional overview Whittlesea Northern Metropolitan is home to approximately 785,000 people, or one fifth of Melbourne’s total population. Comprising a mixture of urban and rural local government areas, the region has experienced very strong population growth in recent years, particularly in its outer areas. It has a culturally diverse population and varying levels of prosperity and disadvantage across the region. Hume NORTHERN METROPOLITAN Nillumbik Melton Yarra Ranges (C) WESTERN METROPOLITAN Moreland Darebin Brimbank Moonee Banyule Valley EASTERN METROPOLITAN Manningham Maribyrnong Hobsons Bay Yarra Maroondah Boroondara MELBOURNE Port Whitehorse Phillip Stonnington Wyndham Glen Eira Monash Knox Bayside INNER METROPOLITAN Kingston Greater Dandenong Casey Frankston SOUTHERN METROPOLITAN Cardinia The region includes the local government areas of Banyule, Darebin, Hume, Moreland, Nillumbik and Whittlesea. Mornington Peninsula Economy and outlook • The Northern Metropolitan economy continues to undergo a period of transition. With traditional strength in Manufacturing, the region has been developing a knowledge economy, particularly in its inner local government areas, which are home to educational and research precincts. Manufacturing remains the largest industry employer, however (see Figure 7), while the Transport, Logistics and Warehousing sectors are important in a region which includes Melbourne Airport and is considered the northern gateway to Melbourne. • Manufacturing in Melbourne’s North is itself experiencing restructure; Automotive, Food Processing and Chemicals are the three largest Manufacturing sub-sectors, each facing a different outlook. • Automotive is undergoing sustained pressure from global competition, while Food Processing will potentially benefit from cluster opportunities presented by infrastructure developments and the relocation of the Melbourne Wholesale Fruit and Vegetable Market to Epping. Chemical Manufacturing, with its links to research and development and higher level skills requirements, is aligned with the region’s wider transition to a knowledge based economy. • Northern Metropolitan has the second highest unemployment rate across the Melbourne regions. Unemployment and low participation rates are a particular issue for young people in the region’s disadvantaged areas. • The region has seen rapid population growth, particularly in the outer areas of Hume and Whittlesea, and this is forecast to continue into the future. Ensuring adequate employment, infrastructure and amenities are developed in line with the unprecedented growth is a regional priority. While new jobs are being added to the region, they tend to be higher skilled, while those being lost are more likely to be lower skilled. • Developing lifelong learning opportunities will be key to building the skills of local residents and creating pathways to employment for the region’s youth, new migrants, low skilled and unemployed residents. Key training challenges for the region • Continuing to provide opportunities for workers facing retrenchment to retrain and refresh their skills, in order to facilitate successful transition into alternative industry employment in the region. • Supporting skills deepening among the resident population to increase alignment with the higher level skills increasingly needed by local industry. Despite pockets of high unemployment, the region is experiencing skill shortages – particularly in higher level technical skills associated with advanced Manufacturing and engineering. • Ongoing development of linkages between industry, schools and training providers to create pathways to employment, ensuring that the training on offer matches local job opportunities. • Promoting awareness of the training system and what it has to offer among local employers, to enable them to tailor training to ensure it addresses their specific needs. Vocational Training: Victoria’s Regional Report 2012 46
