Chapter 4
advertisement
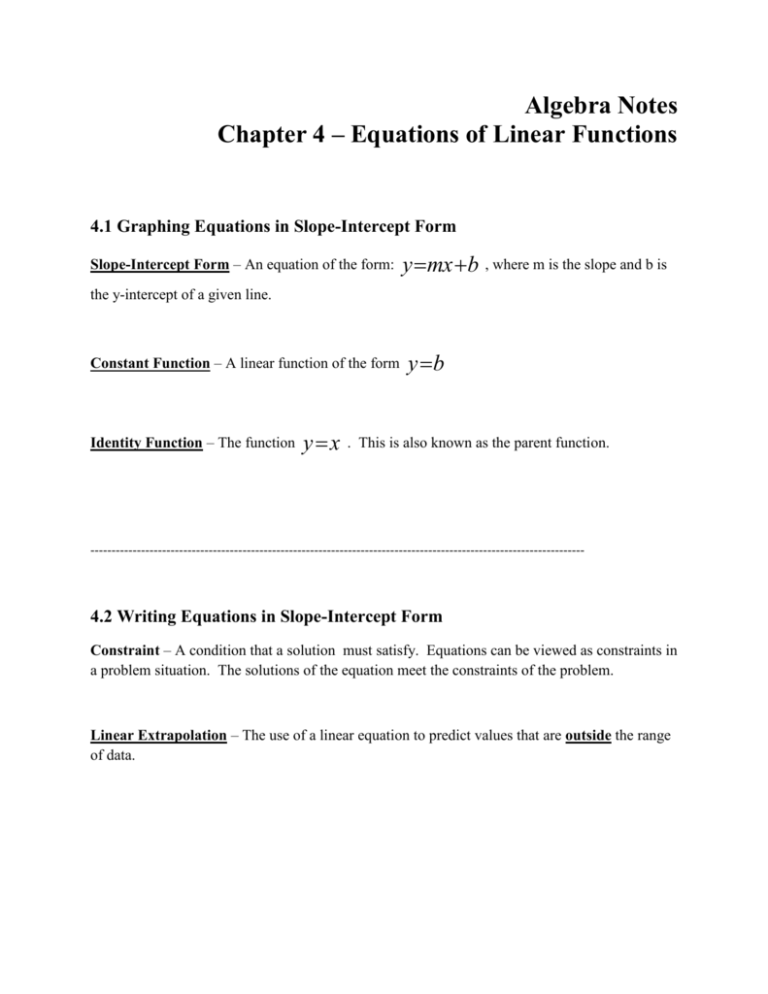
Algebra Notes Chapter 4 – Equations of Linear Functions 4.1 Graphing Equations in Slope-Intercept Form Slope-Intercept Form – An equation of the form: y mx b , where m is the slope and b is the y-intercept of a given line. Constant Function – A linear function of the form Identity Function – The function y x y b . This is also known as the parent function. --------------------------------------------------------------------------------------------------------------------- 4.2 Writing Equations in Slope-Intercept Form Constraint – A condition that a solution must satisfy. Equations can be viewed as constraints in a problem situation. The solutions of the equation meet the constraints of the problem. Linear Extrapolation – The use of a linear equation to predict values that are outside the range of data. 4.3 Writing Equations in Point-Slope Form Point-Slope Form – For any given point (X,Y) on a non-vertical line having slope M, the pointslope form of a linear equation is as follows: y y = m(x x ) 1 1 Standard Form – The standard form of a linear equation is: Ax By C , where A, B and C are integers, A 0, and A and B are not both zero --------------------------------------------------------------------------------------------------------------------- 4.4 Parallel and Perpendicular Lines Parallel Lines – Lines in the plane that never intersect. Non-vertical parallel lines have the same slope. Same slope equals parallel lines! Perpendicular Lines – Lines that meet to form right angles. Two slopes that multiply to be -1 are considered perpendicular lines. Think… opposite reciprocals! --------------------------------------------------------------------------------------------------------------------- 4.5 Scatter Plots and Lines of Fit Bivariate Data – Data with two variables Scatter Plot – In a scatter plot, the two sets of data are plotted as ordered pairs in the coordinate plane Line of Fit – A line that describes the trend of data. Linear Interpolation – The use of a linear equation to predict values that are inside of the data range. Positive Correlation – There is a positive correlation between x and y if the values are related in the same way Negative Correlation - There is a negative correlation between x and y if the values are related in opposite ways --------------------------------------------------------------------------------------------------------------------- 4.6 Regression and Median-Fit Lines Best-fit Line – A line drawn on a scatter plot that passes close to most of the data points Linear Regression – An algorithm to find a precise line of fit for a set of data. Correlation Coefficient – A value that shows how close data points are to a line. Residual – The difference between an observed y-value and its predicted y-value on a regression line. Median Fit Line – A type of best fit line that is calculated using the medians of the coordinates of the data points. 4.7 Inverse Linear Functions Inverse Relation – The set of ordered pairs obtained by exchanging the x-coordinates with the y-coordinates of each ordered pair in a relation. If (5,3) is an ordered pair of a relation, then (3.5) is an ordered pair of the inverse relation. Inverse Function – The inverse of the linear function f (x ) can be written as f 1 ( x) and is read “ f of x inverse” or “the inverse of f of x” ---------------------------------------------------------------------------------------------------------------------
