Activity 3.1.5 Unlocking the Secrets in Our Genes Introduction
advertisement
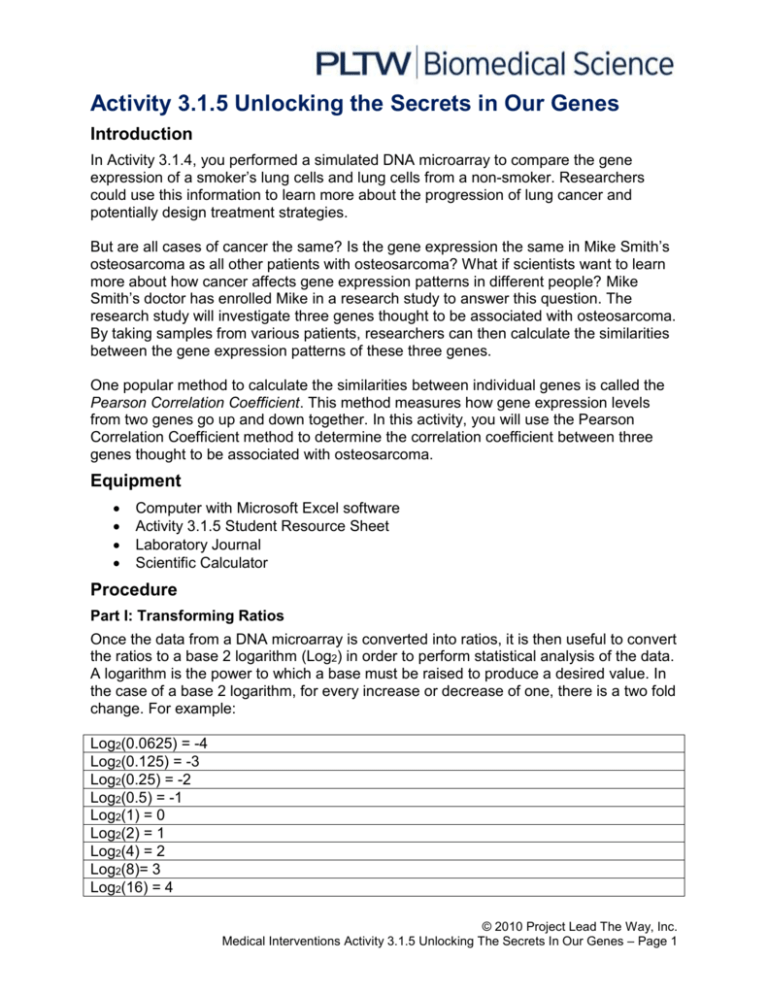
Activity 3.1.5 Unlocking the Secrets in Our Genes Introduction In Activity 3.1.4, you performed a simulated DNA microarray to compare the gene expression of a smoker’s lung cells and lung cells from a non-smoker. Researchers could use this information to learn more about the progression of lung cancer and potentially design treatment strategies. But are all cases of cancer the same? Is the gene expression the same in Mike Smith’s osteosarcoma as all other patients with osteosarcoma? What if scientists want to learn more about how cancer affects gene expression patterns in different people? Mike Smith’s doctor has enrolled Mike in a research study to answer this question. The research study will investigate three genes thought to be associated with osteosarcoma. By taking samples from various patients, researchers can then calculate the similarities between the gene expression patterns of these three genes. One popular method to calculate the similarities between individual genes is called the Pearson Correlation Coefficient. This method measures how gene expression levels from two genes go up and down together. In this activity, you will use the Pearson Correlation Coefficient method to determine the correlation coefficient between three genes thought to be associated with osteosarcoma. Equipment Computer with Microsoft Excel software Activity 3.1.5 Student Resource Sheet Laboratory Journal Scientific Calculator Procedure Part I: Transforming Ratios Once the data from a DNA microarray is converted into ratios, it is then useful to convert the ratios to a base 2 logarithm (Log2) in order to perform statistical analysis of the data. A logarithm is the power to which a base must be raised to produce a desired value. In the case of a base 2 logarithm, for every increase or decrease of one, there is a two fold change. For example: Log2(0.0625) = -4 Log2(0.125) = -3 Log2(0.25) = -2 Log2(0.5) = -1 Log2(1) = 0 Log2(2) = 1 Log2(4) = 2 Log2(8)= 3 Log2(16) = 4 © 2010 Project Lead The Way, Inc. Medical Interventions Activity 3.1.5 Unlocking The Secrets In Our Genes – Page 1 The gene expression ratios in base 2 logarithm form can be used to give meaning to DNA microarray results: When the ratio is positive, it means that the gene is induced by tumor formation. This means that the gene transcription was more active in cancer cells than in normal cells. When the ratio is negative, it means that the gene is suppressed by tumor formation. This means that the gene transcription was less active in cancer cells than in normal cells. When the ratio is equal to one, the gene is not affected by tumor formation. This means that the gene transcription was the same in cancer cells as it was in normal cells. When the ratio is zero, the gene is not expressed in either cell. In order to understand why scientists convert gene expression ratios to base 2 logarithms, we will look at the gene expression ratios from three different patients: Table One: Gene Expression Ratios for Three Osteosarcoma Patients Gene 1 Gene 2 Gene 3 Mike Smith (Patient 1) 1.4 1.1 0.5 Patient 2 2.3 1.33 0.65 Patient 3 3.1 1.82 0.25 1. Obtain a Student Resource Sheet from your teacher. 2. Graph the gene expression ratios from Table One. Follow steps 1-14 on the Student Resource Sheet for directions on how to create your graph. 3. Create a new data table converting the gene expression ratios into base 2 logarithms and graph the information. Follow steps 15-19 on the Students Resource Sheet for directions on how to do this. 4. Print two copies of your data tables and graphs. Attach one copy into your laboratory journal. Hand in the other copy to your teacher. 5. Answer Conclusion questions 1 – 3. Part II: Calculate the Mean and Standard Deviation Now that you have converted the gene expression ratios for the osteosarcoma patients into base 2 logarithm form, you will now calculate the mean, or average of the gene expression values, and the standard deviation, the measure of how spread out the gene expression values are. 6. Note that your teacher will assign you either Gene 2 or Gene 3. Work with a partner to complete the remainder of the steps in Part II and Part III for this assigned gene. Use the completed data table for Gene 1, found below, as your example to help you complete steps 7-13. Notice that the transformed gene expression ratios have been rounded to the nearest hundredth. For all calculations, you round to the nearest hundredth where appropriate. If a calculation is smaller than 0.005, round this number to 0.01. © 2010 Project Lead The Way, Inc. Medical Interventions Activity 3.1.5 Unlocking The Secrets In Our Genes – Page 2 Example: Mean and Standard Deviation for Gene 1: Gene Expressions Deviance (Log2) Mike Smith (Patient 1) 0.49 0.49 - 1.11 = -0.62 Patient 2 1.20 1.20 - 1.11 = 0.09 Patient 3 1.63 1.63 - 1.11 = 0.52 Mean = (0.49 + 1.20 + 1.63) ÷ 3 = 1.11 Sum of Squared Deviances = 0.38 + 0.01 + 0.27 = 0.66 (Sum of Squared Deviances) ÷ 2 = 0.66 ÷ 2 = 0.33 Standard Deviation = √ (0.33) = 0.57 Deviance2 (-0.62) 2 = 0.38 (0.09) 2 = 0.01 (0.52) 2 = 0.27 7. Fill-in the “Gene Expressions (Log2)” column for your assigned gene in Table Two below. Table Two: Mean and Standard Deviation for Assigned Gene: Gene Expressions (Log2) Deviance (Log2 Gene Expression – Mean) Deviance2 Mike Smith (Patient 1) Patient 2 Patient 3 Mean = Sum of Squared Deviances = (Sum of Squared Deviances) ÷ 2 = Standard Deviation = 8. Calculate the mean for your assigned gene. Do this by adding the gene expressions for your assigned gene together and divide by three. Fill-in the calculated mean for your gene in Table Two. 9. Calculate the deviance for each gene expression (how far each of the gene expression ratios is from the mean). Do this by subtracting the mean from each of the gene expressions. Fill-in the “Deviance” columns for each gene in Table Two. 10. Square all of the deviances for each gene. Fill-in the “Deviance2” column for each gene in Table Two. 11. Calculate the sum of all the squared deviances for each gene. Fill-in this information in the “Sum of Squared Deviances =” row in Table Two. 12. Divide the sum you got in step 11 by 2 (this is the total number of genes minus 1). Fill-in this information in the “(Sum of Squared Deviances) ÷ 2 “ row in Table Two. 13. Calculate the square root of the result from step 12. The result of this calculation is the standard deviation. Fill-in the standard deviation in Table Two. Part III: Normalize the Gene Expression Values The next step toward determining the correlation coefficient between the gene expression patterns between Gene 1 and your assigned gene is to normalize the gene expression values. Normalizing the gene expression values removes the statistical error from the data. © 2010 Project Lead The Way, Inc. Medical Interventions Activity 3.1.5 Unlocking The Secrets In Our Genes – Page 3 14. Use the completed data table for gene one as your example, found below, to help you as you complete step 15. Example: Normalized Gene Expressions for Gene 1: Gene Expressions (Log2) Mike Smith (Patient 1) Patient 2 Patient 3 0.49 1.20 1.63 Normalized Gene Expressions -0.62 ÷ 0.57 = -1.09 0.09 ÷ 0.57 = 0.16 0.52 ÷ 0.57 = 0.91 15. Normalize the gene expression values for each patient for your assigned gene by dividing the deviance by the standard deviation. Fill-in the normalized gene expressions in Table Three, found below as well as Table Four. Table Three: Normalized Gene Expressions for Assigned Gene: Normalized Gene Gene Expressions (Log2) Expressions (Deviance ÷ Std Deviation) Mike Smith (Patient 1) Patient 2 Patient 3 16. Work with a group that was assigned the other gene to fill-in the data table below. Table Four: Normalized Gene Expressions for All Three Genes: Gene 1: Gene 2: Mike Smith (Patient 1): -1.09 Patient 2: 0.16 Patient 3: 0.91 Gene 3: Part IV: Calculate the Correlation Coefficient The correlation coefficient will indicate the relationship between two genes. When the correlation coefficient is positive, it means that the gene expressions behave similarly. The larger the correlation coefficient, the stronger the relationship. When the correlation coefficient is negative, it means that the gene expressions behave in opposite ways. The farther away the correlation coefficient is from zero, the stronger the relationship. When the correlation coefficient is one, it means that the gene expressions are identical. When the correlation coefficient is zero, it means that the gene expressions behave in an unrelated manner. 17. Multiply each patient’s normalized gene expression for gene 1 by his or her normalized gene expression for gene 2. Complete these calculations in the “Gene 1 Compared with Gene 2” column in Table Five below. For example, for Mike Smith, you should do the following calculation: -1.09 x -0.89 = 0.97 © 2010 Project Lead The Way, Inc. Medical Interventions Activity 3.1.5 Unlocking The Secrets In Our Genes – Page 4 Table Five: Correlation Coefficients Gene 1 Compared with Gene 2: (-1.09) x (Mike Smith (Patient 1): 0.89) = 0.97 (0.16) x (-0.16) Patient 2: = -0.03 (0.91) x (1.05) Patient 3: = 0.96 0.97 + -0.03 + Sum Product = 0.96 = 1.90 Correlation Coefficient 1.90 ÷ 3 = (Sum Product ÷ 3) = 0.63 Gene 1 Compared with Gene 3: Gene 2 Compared with Gene 3: 18. Calculate the Sum Product (also called the Dot Product) for Gene 1 Compared with Gene 2. Do this by adding all of the products for each patient together. Complete this calculation in the “Sum Product” row for Gene 1 Compared with Gene 2 in Table Five. For example, for Gene 1 Compared with Gene 2, you should do the following calculation: 0.97 + -0.03 + 0.96 = 1.90 19. Divide the Sum Product by 3 (because there are three patients that we are looking at). The result is called the Correlation Coefficient. Complete this calculation in the “Correlation Coefficient” row in Table Five. For example, to determine the Correlation Coefficient for Gene 1 Compared with Gene 2, you should do the following calculation: 1.90 ÷ 3 = 0.63 20. Use Gene 1 Compared with Gene 2 as your example and repeat steps 17 – 19 to calculate the Correlation Coefficients for Gene 1 Compared with Gene 3 and for Gene 2 Compared with Gene 3. Fill-in the remainder of Table Five. Show your work. 21. Answer the remaining Conclusion questions. Conclusion Questions 1. How do the two graphs compare? Looking at the graphs, explain why you think scientists convert the gene expression ratios into logarithmic form? 2. Using the graph of log2 ratios, which genes do you think are induced by tumor formation? Which genes do you think are suppressed by tumor formation? © 2010 Project Lead The Way, Inc. Medical Interventions Activity 3.1.5 Unlocking The Secrets In Our Genes – Page 5 3. Using the graph of log2 ratios, which genes would you select for further study of osteosarcoma? Explain your choice(s). 4. What does the correlation coefficient indicate about the similarities between the gene expression for Gene 1 and the gene expression for Gene 2? What does this number indicate about how these genes might be expressed in different osteosarcoma patients? 5. What does the correlation coefficient indicate about the similarities between the gene expression for Gene 1 and the gene expression for Gene 3? What does this number indicate about how these genes might be expressed in different osteosarcoma patients? 6. What does the correlation coefficient indicate about the similarities between the gene expression for Gene 2 and the gene expression for Gene 3? What does this number indicate about how these genes might be expressed in different osteosarcoma patients? 7. Why would doctors and researchers want to know the correlation coefficient for a specific gene in a sample of patients with the same type of cancer? How can this data help cancer patients or evaluate risk? 8. We used the Pearson Correlation Coefficient method to analyze DNA microarray results of three patients with the same type of cancer. How could you use this same method to learn more about cancer cells before and after a particular treatment? Web Portfolio 1) In a short paragraph describe why special calculations are needed for microarray results as well as what you have learned about the Pearson Correlation Coefficient. © 2010 Project Lead The Way, Inc. Medical Interventions Activity 3.1.5 Unlocking The Secrets In Our Genes – Page 6

