Revision Population Ans - S2OrtusGeog2015
advertisement

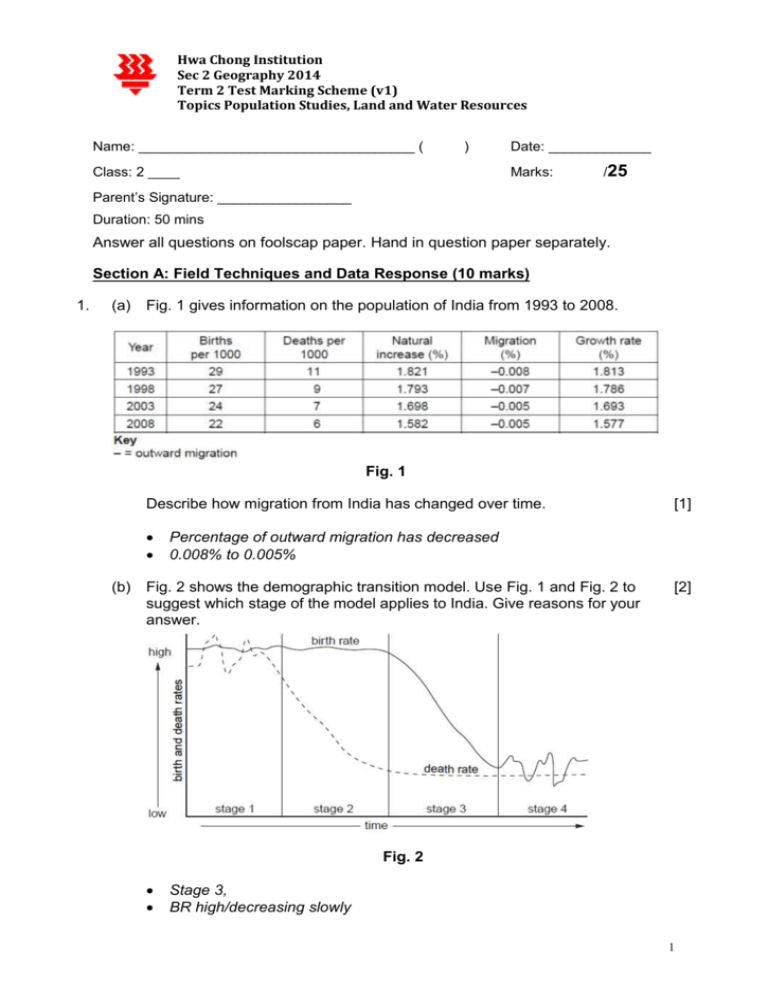
Hwa Chong Institution Sec 2 Geography 2014 Term 2 Test Marking Scheme (v1) Topics Population Studies, Land and Water Resources Name: ___________________________________ ( ) Class: 2 ____ Date: _____________ Marks: /25 Parent’s Signature: _________________ Duration: 50 mins Answer all questions on foolscap paper. Hand in question paper separately. Section A: Field Techniques and Data Response (10 marks) 1. (a) Fig. 1 gives information on the population of India from 1993 to 2008. Fig. 1 Describe how migration from India has changed over time. (b) [1] Percentage of outward migration has decreased 0.008% to 0.005% Fig. 2 shows the demographic transition model. Use Fig. 1 and Fig. 2 to suggest which stage of the model applies to India. Give reasons for your answer. [2] Fig. 2 Stage 3, BR high/decreasing slowly 1 2. DR low/decreasing Percentage of natural increase is slowing Fig. 3 shows population pyramids of Country X from 1990 to 2010. 1990 2010 Fig. 3 (a) Calculate the percentage of young and old dependents in Country X in 1990 and 2010 respectively. Young dep Working pop Elder dep (b) 1990 21.5% 65.8% 12.7% 34.2% Allow 2% [2] 2010 15.1% 68.8% 15.1% 30.2% Describe the changes in the population structure of Country X between 1990 and 2000. [3] The population pyramid in 2010 has a narrow base than the pyramid in 1990 indicating birth rate has decreased 2010 pyramid has a slightly broader apex than 1990 indicating growing elderly group The sides of the pyramid in 2010 is steeper showing death rate has reduced the proportion of young dependents in 2010 is significantly lower than in 1990: 21.5 % in 1990 and 15.5% in 2010 working population increased slightly from 65.8% in 1990 to 68.8% in 2010 proportion of elderly increased from 12.7% in 1990 to 15.1% in 2010 [max 2.5m if no statistics are given] 2 Section B: Structured Essay and Open Ended Questions (15 marks) 1. Discuss the social problems brought about by China’s one child policy. • • • • • • 3. The policy has been heavily criticised for taking away the rights of the individual to choose the size of their family. The one-child policy has also been associated with induced abortions and infanticide of girls, skewing China's gender balance. In 2005, 119 boys were born for every 100 girls. China now has a shrinking population of working- aged adults. As the population ages there will be fewer people of working age to support the elderly. The standard of care for the elderly in China has already declined sharply as a result of this attempt at population control. Led to shortage of labour in farms of rural areas – lower yield and income – lower standard of living further widening income gap between rural and urban areas Created a ‘strawberry’ generation that is over-pampered and spoilt Ageing population Discuss the economic problems brought about by China’s one child policy in the near future. 2. [3] economic slowdown - Experts have warned that China might lose its 'demographic dividend' by 2015. Shortage of labour in the manufacturing sector There will be an increased in dependency ratio By 2050, China will have just 1.6 working-age adults to take care of each person aged 60 or older - a far cry from the 7.7 figure in 1975. An ageing population implies resources have to be channeled to meet the needs of the elderly such as building more elderly care centre and healthcare services Describe three problems caused by an ageing population in Singapore. [4] [3] Shrinking workforce Less competitive Increased financial burden on the working population More taxes Lesser men enlisted into the army Weaken national defence - End of Paper – Source Acknowledgements Section A Q1 Fig 1 & 2 Q2 Fig 3 Q3 Fig 4 IGCSE May/June 2010 http://michelbaudin.com/2012/07/11/metrics-in-lean-part-5-lead-times-and-inventory/ http://worldgeographyenquiries.blogspot.sg/2010/10/is-there-link-between-economicgrowth.html 3 4


