Additional file 3: Table S2. - Molecular Neurodegeneration
advertisement
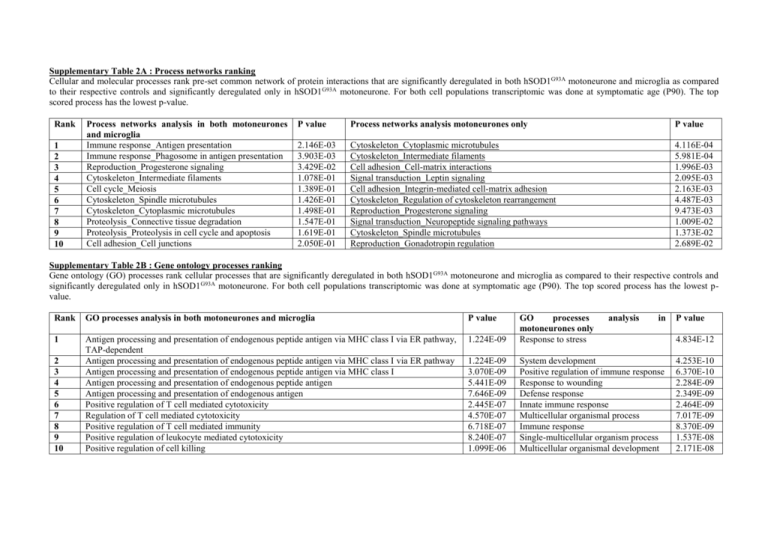
Supplementary Table 2A : Process networks ranking Cellular and molecular processes rank pre-set common network of protein interactions that are significantly deregulated in both hSOD1G93A motoneurone and microglia as compared to their respective controls and significantly deregulated only in hSOD1G93A motoneurone. For both cell populations transcriptomic was done at symptomatic age (P90). The top scored process has the lowest p-value. Rank 1 2 3 4 5 6 7 8 9 10 Process networks analysis in both motoneurones and microglia Immune response_Antigen presentation Immune response_Phagosome in antigen presentation Reproduction_Progesterone signaling Cytoskeleton_Intermediate filaments Cell cycle_Meiosis Cytoskeleton_Spindle microtubules Cytoskeleton_Cytoplasmic microtubules Proteolysis_Connective tissue degradation Proteolysis_Proteolysis in cell cycle and apoptosis Cell adhesion_Cell junctions P value Process networks analysis motoneurones only P value 2.146E-03 3.903E-03 3.429E-02 1.078E-01 1.389E-01 1.426E-01 1.498E-01 1.547E-01 1.619E-01 2.050E-01 Cytoskeleton_Cytoplasmic microtubules Cytoskeleton_Intermediate filaments Cell adhesion_Cell-matrix interactions Signal transduction_Leptin signaling Cell adhesion_Integrin-mediated cell-matrix adhesion Cytoskeleton_Regulation of cytoskeleton rearrangement Reproduction_Progesterone signaling Signal transduction_Neuropeptide signaling pathways Cytoskeleton_Spindle microtubules Reproduction_Gonadotropin regulation 4.116E-04 5.981E-04 1.996E-03 2.095E-03 2.163E-03 4.487E-03 9.473E-03 1.009E-02 1.373E-02 2.689E-02 Supplementary Table 2B : Gene ontology processes ranking Gene ontology (GO) processes rank cellular processes that are significantly deregulated in both hSOD1G93A motoneurone and microglia as compared to their respective controls and significantly deregulated only in hSOD1G93A motoneurone. For both cell populations transcriptomic was done at symptomatic age (P90). The top scored process has the lowest pvalue. Rank GO processes analysis in both motoneurones and microglia P value 1 Antigen processing and presentation of endogenous peptide antigen via MHC class I via ER pathway, TAP-dependent Antigen processing and presentation of endogenous peptide antigen via MHC class I via ER pathway Antigen processing and presentation of endogenous peptide antigen via MHC class I Antigen processing and presentation of endogenous peptide antigen Antigen processing and presentation of endogenous antigen Positive regulation of T cell mediated cytotoxicity Regulation of T cell mediated cytotoxicity Positive regulation of T cell mediated immunity Positive regulation of leukocyte mediated cytotoxicity Positive regulation of cell killing 1.224E-09 GO processes motoneurones only Response to stress 1.224E-09 3.070E-09 5.441E-09 7.646E-09 2.445E-07 4.570E-07 6.718E-07 8.240E-07 1.099E-06 System development Positive regulation of immune response Response to wounding Defense response Innate immune response Multicellular organismal process Immune response Single-multicellular organism process Multicellular organismal development 2 3 4 5 6 7 8 9 10 analysis in P value 4.834E-12 4.253E-10 6.370E-10 2.284E-09 2.349E-09 2.464E-09 7.017E-09 8.370E-09 1.537E-08 2.171E-08 Supplementary Table 2C : Pathway maps ranking Canonical pathway maps rank signaling and metabolic maps that are significantly in both hSOD1G93A motoneurone and microglia as compared to their respective controls and significantly deregulated only in hSOD1G93A motoneurone. For both cell populations transcriptomic was done at symptomatic age (P90). The top scored process has the lowest pvalue. Rank 1 2 3 4 5 6 7 8 9 10 Pathway maps analysis in both motoneurones and microglia Immune response_Antiviral actions of Interferons Glycine, serine, cysteine and threonine metabolism Glycine, serine, cysteine and threonine metabolism/ Rodent version Schema: Initiation of T cell recruitment in allergic contact dermatitis Proteolysis_Role of Parkin in the Ubiquitin-Proteasomal Pathway Cytoskeleton remodeling_Neurofilaments Development_Role of CNTF and LIF in regulation of oligodendrocyte development Immune response_Antigen presentation by MHC class I Cell adhesion_Gap junctions Cell cycle_Role of Nek in cell cycle regulation P value 1.117E-03 5.905E-03 6.096E-03 1.762E-02 2.343E-02 2.439E-02 2.729E-02 Pathway maps analysis in motoneurones only Cytoskeleton remodeling_Neurofilaments Cytoskeleton remodeling_Keratin filaments Transcription_Transcription regulation of aminoacid metabolism Reproduction_GnRH signaling Cell adhesion_Gap junctions Cell cycle_Role of Nek in cell cycle regulation Immune response_Oncostatin M signaling via MAPK in mouse cells P value 4.762E-08 1.368E-05 1.438E-04 2.146E-04 2.502E-04 3.039E-04 3.975E-04 2.729E-02 2.921E-02 3.113E-02 Immune response_Oncostatin M signaling via MAPK in human cells Development_Beta-adrenergic receptors transactivation of EGFR Development_Astrocyte differentiation from adult stem cells 4.692E-04 4.692E-04 5.916E-04
